Samoan vs Spanish Disability
COMPARE
Samoan
Spanish
Disability
Disability Comparison
Samoans
Spanish
12.2%
DISABILITY
2.6/ 100
METRIC RATING
230th/ 347
METRIC RANK
12.8%
DISABILITY
0.0/ 100
METRIC RATING
280th/ 347
METRIC RANK
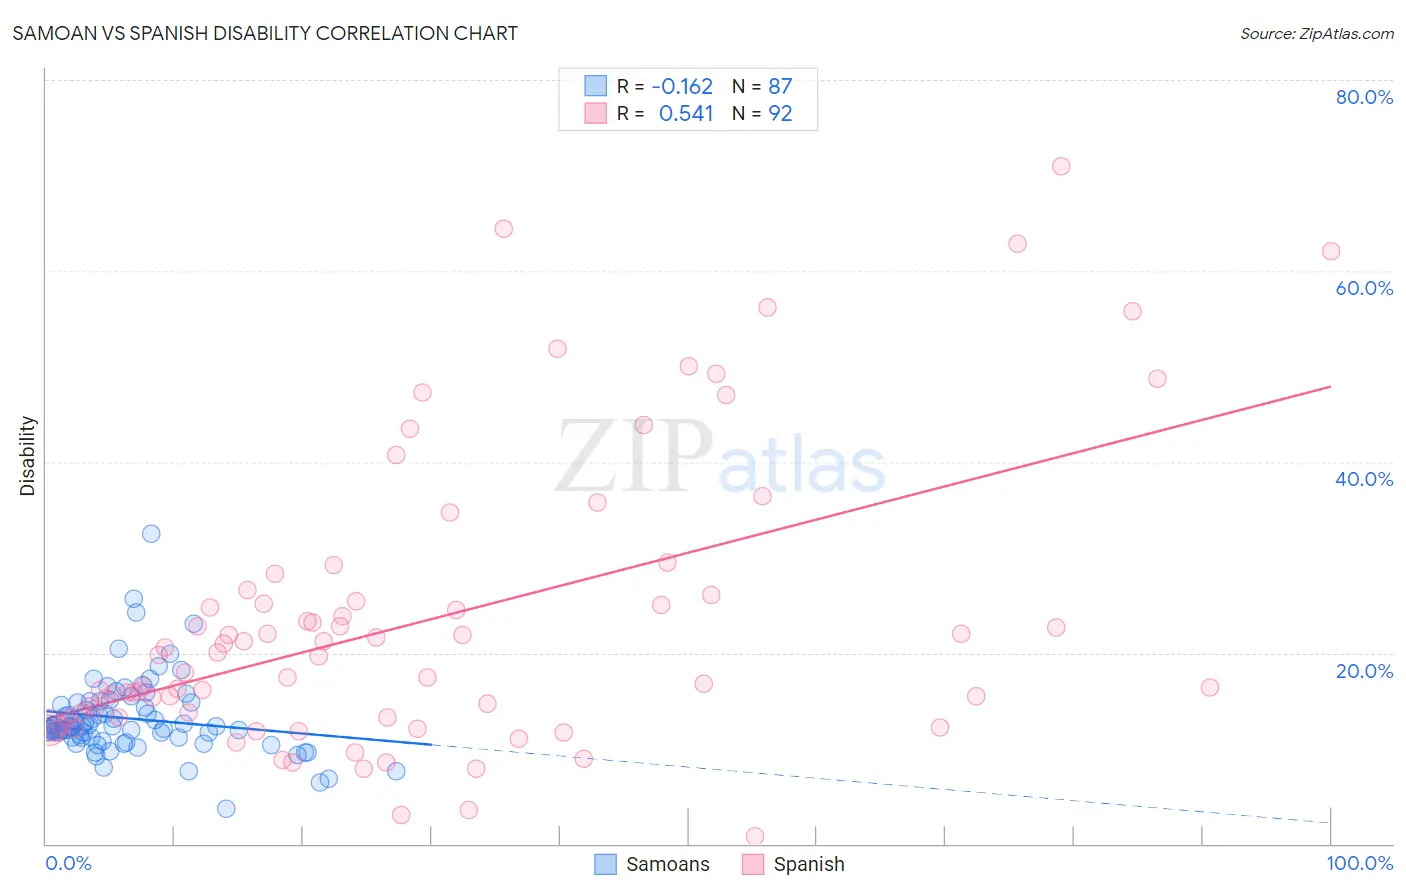
Samoan vs Spanish Disability Correlation Chart
The statistical analysis conducted on geographies consisting of 225,125,318 people shows a poor negative correlation between the proportion of Samoans and percentage of population with a disability in the United States with a correlation coefficient (R) of -0.162 and weighted average of 12.2%. Similarly, the statistical analysis conducted on geographies consisting of 422,113,080 people shows a substantial positive correlation between the proportion of Spanish and percentage of population with a disability in the United States with a correlation coefficient (R) of 0.541 and weighted average of 12.8%, a difference of 5.6%.
Disability Correlation Summary
| Measurement | Samoan | Spanish |
| Minimum | 3.6% | 0.84% |
| Maximum | 32.5% | 71.0% |
| Range | 28.8% | 70.1% |
| Mean | 13.1% | 23.3% |
| Median | 12.3% | 18.8% |
| Interquartile 25% (IQ1) | 11.1% | 13.2% |
| Interquartile 75% (IQ3) | 14.7% | 25.7% |
| Interquartile Range (IQR) | 3.6% | 12.5% |
| Standard Deviation (Sample) | 4.1% | 15.1% |
| Standard Deviation (Population) | 4.1% | 15.0% |
Similar Demographics by Disability
Demographics Similar to Samoans by Disability
In terms of disability, the demographic groups most similar to Samoans are Malaysian (12.2%, a difference of 0.030%), Italian (12.2%, a difference of 0.040%), Inupiat (12.2%, a difference of 0.080%), West Indian (12.2%, a difference of 0.10%), and Bahamian (12.2%, a difference of 0.13%).
| Demographics | Rating | Rank | Disability |
| Hispanics or Latinos | 3.9 /100 | #223 | Tragic 12.1% |
| Mexicans | 3.7 /100 | #224 | Tragic 12.1% |
| Senegalese | 3.5 /100 | #225 | Tragic 12.1% |
| Jamaicans | 3.3 /100 | #226 | Tragic 12.1% |
| Alsatians | 3.3 /100 | #227 | Tragic 12.1% |
| West Indians | 2.9 /100 | #228 | Tragic 12.2% |
| Inupiat | 2.8 /100 | #229 | Tragic 12.2% |
| Samoans | 2.6 /100 | #230 | Tragic 12.2% |
| Malaysians | 2.5 /100 | #231 | Tragic 12.2% |
| Italians | 2.5 /100 | #232 | Tragic 12.2% |
| Bahamians | 2.3 /100 | #233 | Tragic 12.2% |
| Japanese | 2.3 /100 | #234 | Tragic 12.2% |
| Yup'ik | 2.2 /100 | #235 | Tragic 12.2% |
| Chinese | 2.0 /100 | #236 | Tragic 12.2% |
| Immigrants | Congo | 1.9 /100 | #237 | Tragic 12.2% |
Demographics Similar to Spanish by Disability
In terms of disability, the demographic groups most similar to Spanish are Fijian (12.8%, a difference of 0.050%), Immigrants from Portugal (12.9%, a difference of 0.14%), German (12.8%, a difference of 0.15%), Scottish (12.9%, a difference of 0.28%), and Irish (12.9%, a difference of 0.30%).
| Demographics | Rating | Rank | Disability |
| Finns | 0.0 /100 | #273 | Tragic 12.7% |
| Nepalese | 0.0 /100 | #274 | Tragic 12.8% |
| Sioux | 0.0 /100 | #275 | Tragic 12.8% |
| Hmong | 0.0 /100 | #276 | Tragic 12.8% |
| Dutch | 0.0 /100 | #277 | Tragic 12.8% |
| Germans | 0.0 /100 | #278 | Tragic 12.8% |
| Fijians | 0.0 /100 | #279 | Tragic 12.8% |
| Spanish | 0.0 /100 | #280 | Tragic 12.8% |
| Immigrants | Portugal | 0.0 /100 | #281 | Tragic 12.9% |
| Scottish | 0.0 /100 | #282 | Tragic 12.9% |
| Irish | 0.0 /100 | #283 | Tragic 12.9% |
| Welsh | 0.0 /100 | #284 | Tragic 12.9% |
| Crow | 0.0 /100 | #285 | Tragic 12.9% |
| English | 0.0 /100 | #286 | Tragic 13.0% |
| Africans | 0.0 /100 | #287 | Tragic 13.0% |