Immigrants from Hungary vs Spanish Disability
COMPARE
Immigrants from Hungary
Spanish
Disability
Disability Comparison
Immigrants from Hungary
Spanish
11.5%
DISABILITY
79.0/ 100
METRIC RATING
146th/ 347
METRIC RANK
12.8%
DISABILITY
0.0/ 100
METRIC RATING
280th/ 347
METRIC RANK
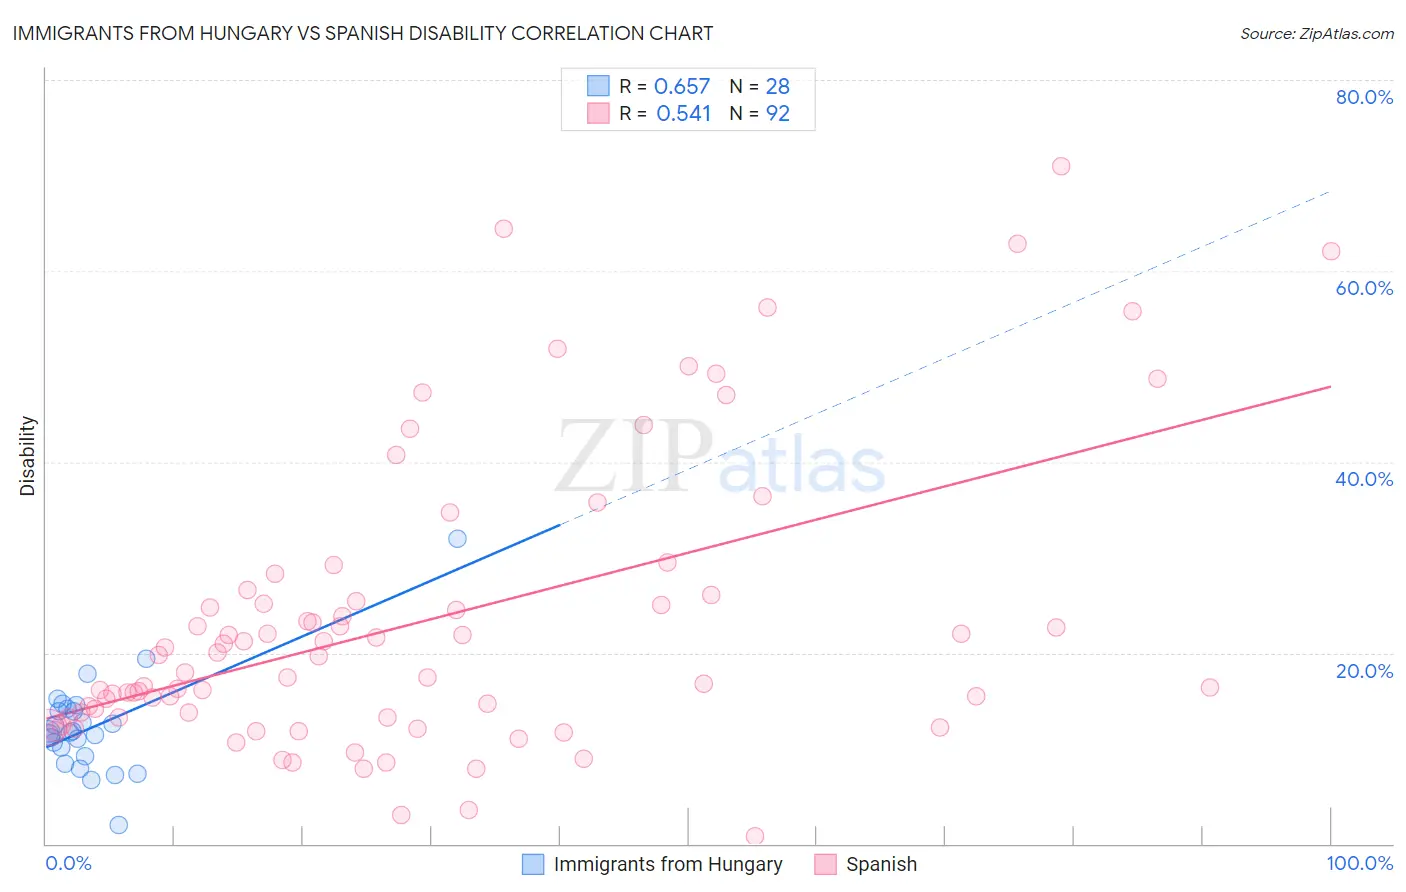
Immigrants from Hungary vs Spanish Disability Correlation Chart
The statistical analysis conducted on geographies consisting of 195,708,395 people shows a significant positive correlation between the proportion of Immigrants from Hungary and percentage of population with a disability in the United States with a correlation coefficient (R) of 0.657 and weighted average of 11.5%. Similarly, the statistical analysis conducted on geographies consisting of 422,113,080 people shows a substantial positive correlation between the proportion of Spanish and percentage of population with a disability in the United States with a correlation coefficient (R) of 0.541 and weighted average of 12.8%, a difference of 11.4%.
Disability Correlation Summary
| Measurement | Immigrants from Hungary | Spanish |
| Minimum | 2.0% | 0.84% |
| Maximum | 32.0% | 71.0% |
| Range | 30.0% | 70.1% |
| Mean | 12.2% | 23.3% |
| Median | 11.6% | 18.8% |
| Interquartile 25% (IQ1) | 9.6% | 13.2% |
| Interquartile 75% (IQ3) | 14.0% | 25.7% |
| Interquartile Range (IQR) | 4.4% | 12.5% |
| Standard Deviation (Sample) | 5.2% | 15.1% |
| Standard Deviation (Population) | 5.1% | 15.0% |
Similar Demographics by Disability
Demographics Similar to Immigrants from Hungary by Disability
In terms of disability, the demographic groups most similar to Immigrants from Hungary are Immigrants from Ukraine (11.5%, a difference of 0.090%), Sudanese (11.5%, a difference of 0.12%), Nigerian (11.5%, a difference of 0.16%), Australian (11.5%, a difference of 0.25%), and Moroccan (11.5%, a difference of 0.32%).
| Demographics | Rating | Rank | Disability |
| Ghanaians | 87.0 /100 | #139 | Excellent 11.5% |
| Russians | 86.8 /100 | #140 | Excellent 11.5% |
| Immigrants | Grenada | 86.1 /100 | #141 | Excellent 11.5% |
| Immigrants | Sudan | 85.3 /100 | #142 | Excellent 11.5% |
| Moroccans | 83.3 /100 | #143 | Excellent 11.5% |
| Australians | 82.5 /100 | #144 | Excellent 11.5% |
| Nigerians | 81.3 /100 | #145 | Excellent 11.5% |
| Immigrants | Hungary | 79.0 /100 | #146 | Good 11.5% |
| Immigrants | Ukraine | 77.6 /100 | #147 | Good 11.5% |
| Sudanese | 77.1 /100 | #148 | Good 11.5% |
| Immigrants | Norway | 73.2 /100 | #149 | Good 11.6% |
| Romanians | 72.7 /100 | #150 | Good 11.6% |
| Immigrants | Kenya | 72.1 /100 | #151 | Good 11.6% |
| Immigrants | Moldova | 72.0 /100 | #152 | Good 11.6% |
| Immigrants | Ghana | 71.2 /100 | #153 | Good 11.6% |
Demographics Similar to Spanish by Disability
In terms of disability, the demographic groups most similar to Spanish are Fijian (12.8%, a difference of 0.050%), Immigrants from Portugal (12.9%, a difference of 0.14%), German (12.8%, a difference of 0.15%), Scottish (12.9%, a difference of 0.28%), and Irish (12.9%, a difference of 0.30%).
| Demographics | Rating | Rank | Disability |
| Finns | 0.0 /100 | #273 | Tragic 12.7% |
| Nepalese | 0.0 /100 | #274 | Tragic 12.8% |
| Sioux | 0.0 /100 | #275 | Tragic 12.8% |
| Hmong | 0.0 /100 | #276 | Tragic 12.8% |
| Dutch | 0.0 /100 | #277 | Tragic 12.8% |
| Germans | 0.0 /100 | #278 | Tragic 12.8% |
| Fijians | 0.0 /100 | #279 | Tragic 12.8% |
| Spanish | 0.0 /100 | #280 | Tragic 12.8% |
| Immigrants | Portugal | 0.0 /100 | #281 | Tragic 12.9% |
| Scottish | 0.0 /100 | #282 | Tragic 12.9% |
| Irish | 0.0 /100 | #283 | Tragic 12.9% |
| Welsh | 0.0 /100 | #284 | Tragic 12.9% |
| Crow | 0.0 /100 | #285 | Tragic 12.9% |
| English | 0.0 /100 | #286 | Tragic 13.0% |
| Africans | 0.0 /100 | #287 | Tragic 13.0% |