Samoan vs Immigrants from Middle Africa Disability
COMPARE
Samoan
Immigrants from Middle Africa
Disability
Disability Comparison
Samoans
Immigrants from Middle Africa
12.2%
DISABILITY
2.6/ 100
METRIC RATING
230th/ 347
METRIC RANK
11.6%
DISABILITY
69.5/ 100
METRIC RATING
157th/ 347
METRIC RANK
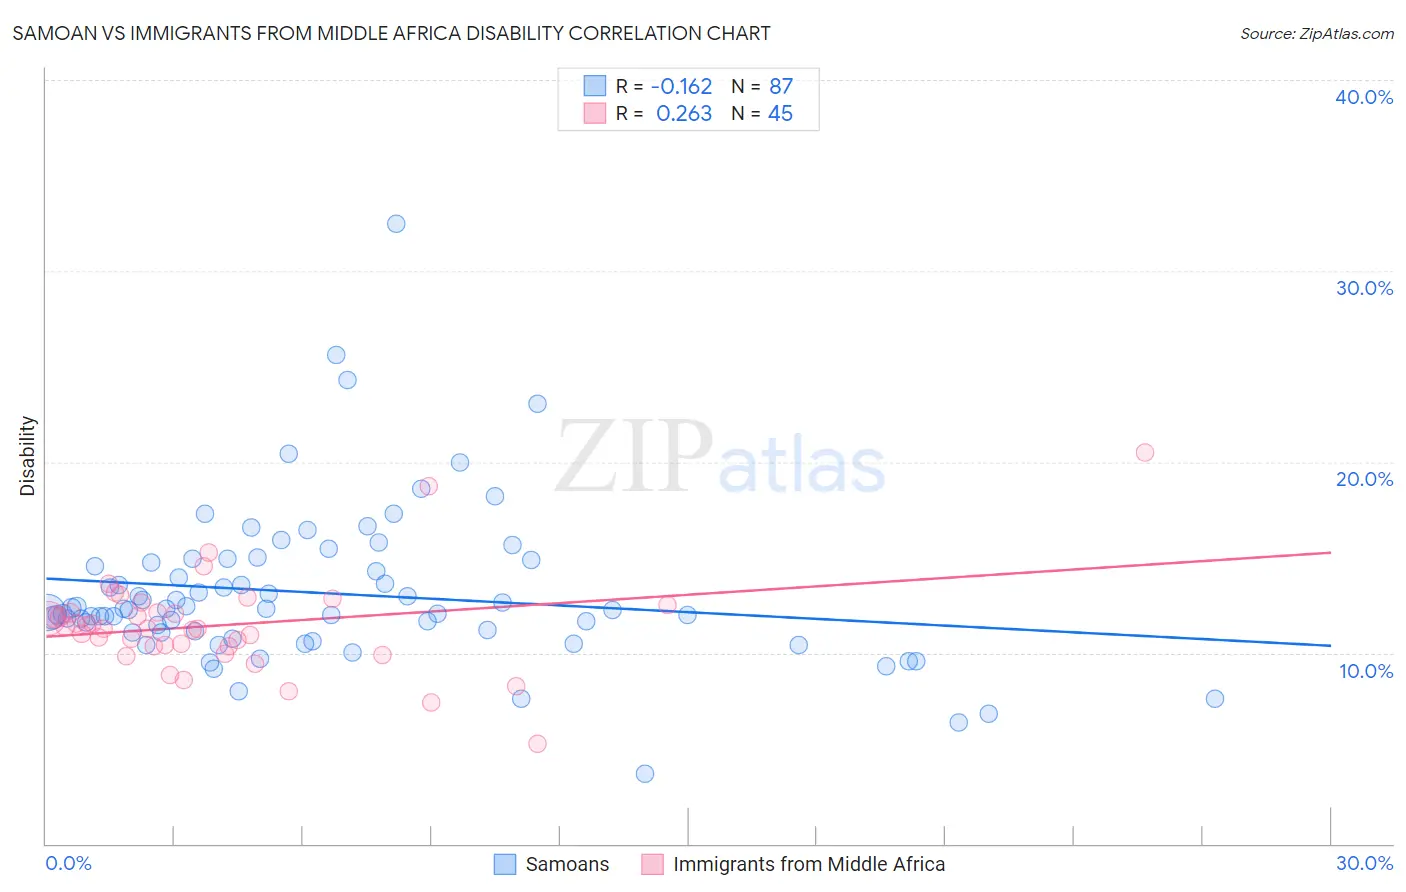
Samoan vs Immigrants from Middle Africa Disability Correlation Chart
The statistical analysis conducted on geographies consisting of 225,125,318 people shows a poor negative correlation between the proportion of Samoans and percentage of population with a disability in the United States with a correlation coefficient (R) of -0.162 and weighted average of 12.2%. Similarly, the statistical analysis conducted on geographies consisting of 202,728,715 people shows a weak positive correlation between the proportion of Immigrants from Middle Africa and percentage of population with a disability in the United States with a correlation coefficient (R) of 0.263 and weighted average of 11.6%, a difference of 5.0%.
Disability Correlation Summary
| Measurement | Samoan | Immigrants from Middle Africa |
| Minimum | 3.6% | 5.2% |
| Maximum | 32.5% | 20.5% |
| Range | 28.8% | 15.3% |
| Mean | 13.1% | 11.4% |
| Median | 12.3% | 11.3% |
| Interquartile 25% (IQ1) | 11.1% | 10.3% |
| Interquartile 75% (IQ3) | 14.7% | 12.3% |
| Interquartile Range (IQR) | 3.6% | 2.0% |
| Standard Deviation (Sample) | 4.1% | 2.6% |
| Standard Deviation (Population) | 4.1% | 2.5% |
Similar Demographics by Disability
Demographics Similar to Samoans by Disability
In terms of disability, the demographic groups most similar to Samoans are Malaysian (12.2%, a difference of 0.030%), Italian (12.2%, a difference of 0.040%), Inupiat (12.2%, a difference of 0.080%), West Indian (12.2%, a difference of 0.10%), and Bahamian (12.2%, a difference of 0.13%).
| Demographics | Rating | Rank | Disability |
| Hispanics or Latinos | 3.9 /100 | #223 | Tragic 12.1% |
| Mexicans | 3.7 /100 | #224 | Tragic 12.1% |
| Senegalese | 3.5 /100 | #225 | Tragic 12.1% |
| Jamaicans | 3.3 /100 | #226 | Tragic 12.1% |
| Alsatians | 3.3 /100 | #227 | Tragic 12.1% |
| West Indians | 2.9 /100 | #228 | Tragic 12.2% |
| Inupiat | 2.8 /100 | #229 | Tragic 12.2% |
| Samoans | 2.6 /100 | #230 | Tragic 12.2% |
| Malaysians | 2.5 /100 | #231 | Tragic 12.2% |
| Italians | 2.5 /100 | #232 | Tragic 12.2% |
| Bahamians | 2.3 /100 | #233 | Tragic 12.2% |
| Japanese | 2.3 /100 | #234 | Tragic 12.2% |
| Yup'ik | 2.2 /100 | #235 | Tragic 12.2% |
| Chinese | 2.0 /100 | #236 | Tragic 12.2% |
| Immigrants | Congo | 1.9 /100 | #237 | Tragic 12.2% |
Demographics Similar to Immigrants from Middle Africa by Disability
In terms of disability, the demographic groups most similar to Immigrants from Middle Africa are Immigrants from Fiji (11.6%, a difference of 0.0%), Immigrants from Netherlands (11.6%, a difference of 0.020%), Immigrants from Ghana (11.6%, a difference of 0.090%), Immigrants from Guatemala (11.6%, a difference of 0.090%), and Immigrants from Kenya (11.6%, a difference of 0.14%).
| Demographics | Rating | Rank | Disability |
| Romanians | 72.7 /100 | #150 | Good 11.6% |
| Immigrants | Kenya | 72.1 /100 | #151 | Good 11.6% |
| Immigrants | Moldova | 72.0 /100 | #152 | Good 11.6% |
| Immigrants | Ghana | 71.2 /100 | #153 | Good 11.6% |
| Immigrants | Guatemala | 71.1 /100 | #154 | Good 11.6% |
| Immigrants | Netherlands | 69.8 /100 | #155 | Good 11.6% |
| Immigrants | Fiji | 69.5 /100 | #156 | Good 11.6% |
| Immigrants | Middle Africa | 69.5 /100 | #157 | Good 11.6% |
| Armenians | 65.9 /100 | #158 | Good 11.6% |
| Guatemalans | 65.1 /100 | #159 | Good 11.6% |
| Immigrants | Barbados | 64.2 /100 | #160 | Good 11.6% |
| Immigrants | Cuba | 62.8 /100 | #161 | Good 11.6% |
| Immigrants | Haiti | 59.2 /100 | #162 | Average 11.7% |
| Immigrants | Trinidad and Tobago | 58.9 /100 | #163 | Average 11.7% |
| Syrians | 58.5 /100 | #164 | Average 11.7% |