Immigrants from India vs Spanish Disability
COMPARE
Immigrants from India
Spanish
Disability
Disability Comparison
Immigrants from India
Spanish
9.5%
DISABILITY
100.0/ 100
METRIC RATING
1st/ 347
METRIC RANK
12.8%
DISABILITY
0.0/ 100
METRIC RATING
280th/ 347
METRIC RANK
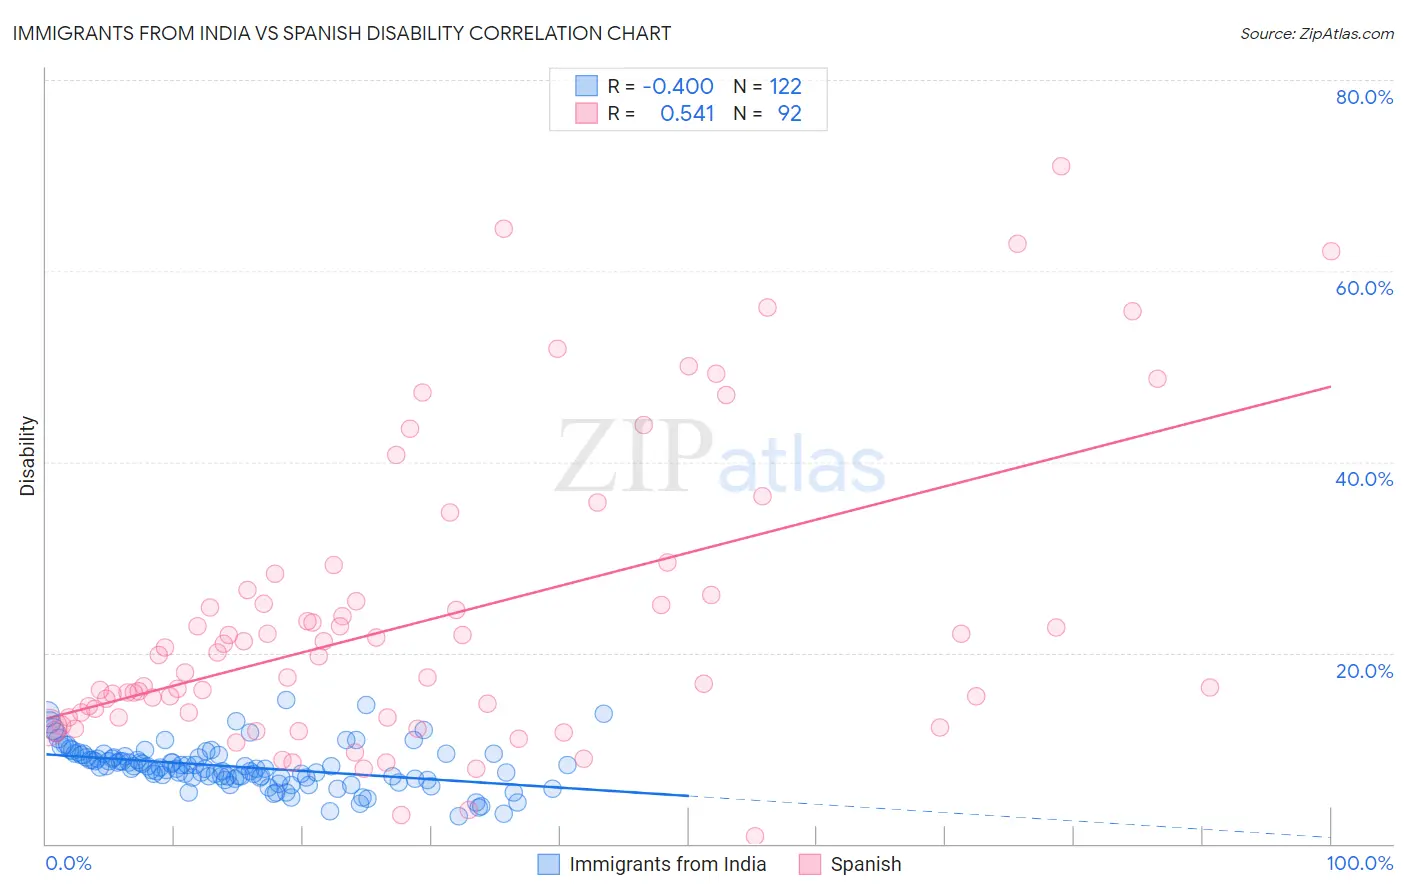
Immigrants from India vs Spanish Disability Correlation Chart
The statistical analysis conducted on geographies consisting of 434,094,669 people shows a mild negative correlation between the proportion of Immigrants from India and percentage of population with a disability in the United States with a correlation coefficient (R) of -0.400 and weighted average of 9.5%. Similarly, the statistical analysis conducted on geographies consisting of 422,113,080 people shows a substantial positive correlation between the proportion of Spanish and percentage of population with a disability in the United States with a correlation coefficient (R) of 0.541 and weighted average of 12.8%, a difference of 35.2%.
Disability Correlation Summary
| Measurement | Immigrants from India | Spanish |
| Minimum | 2.8% | 0.84% |
| Maximum | 15.1% | 71.0% |
| Range | 12.2% | 70.1% |
| Mean | 8.1% | 23.3% |
| Median | 7.9% | 18.8% |
| Interquartile 25% (IQ1) | 6.9% | 13.2% |
| Interquartile 75% (IQ3) | 9.3% | 25.7% |
| Interquartile Range (IQR) | 2.4% | 12.5% |
| Standard Deviation (Sample) | 2.3% | 15.1% |
| Standard Deviation (Population) | 2.3% | 15.0% |
Similar Demographics by Disability
Demographics Similar to Immigrants from India by Disability
In terms of disability, the demographic groups most similar to Immigrants from India are Filipino (9.6%, a difference of 0.98%), Immigrants from Taiwan (9.6%, a difference of 1.1%), Thai (9.7%, a difference of 2.1%), Immigrants from Bolivia (9.9%, a difference of 3.8%), and Immigrants from South Central Asia (9.9%, a difference of 4.7%).
| Demographics | Rating | Rank | Disability |
| Immigrants | India | 100.0 /100 | #1 | Exceptional 9.5% |
| Filipinos | 100.0 /100 | #2 | Exceptional 9.6% |
| Immigrants | Taiwan | 100.0 /100 | #3 | Exceptional 9.6% |
| Thais | 100.0 /100 | #4 | Exceptional 9.7% |
| Immigrants | Bolivia | 100.0 /100 | #5 | Exceptional 9.9% |
| Immigrants | South Central Asia | 100.0 /100 | #6 | Exceptional 9.9% |
| Immigrants | Singapore | 100.0 /100 | #7 | Exceptional 10.0% |
| Bolivians | 100.0 /100 | #8 | Exceptional 10.0% |
| Immigrants | Hong Kong | 100.0 /100 | #9 | Exceptional 10.0% |
| Immigrants | China | 100.0 /100 | #10 | Exceptional 10.1% |
| Iranians | 100.0 /100 | #11 | Exceptional 10.1% |
| Immigrants | Israel | 100.0 /100 | #12 | Exceptional 10.1% |
| Immigrants | Eastern Asia | 100.0 /100 | #13 | Exceptional 10.2% |
| Immigrants | Korea | 100.0 /100 | #14 | Exceptional 10.2% |
| Okinawans | 100.0 /100 | #15 | Exceptional 10.3% |
Demographics Similar to Spanish by Disability
In terms of disability, the demographic groups most similar to Spanish are Fijian (12.8%, a difference of 0.050%), Immigrants from Portugal (12.9%, a difference of 0.14%), German (12.8%, a difference of 0.15%), Scottish (12.9%, a difference of 0.28%), and Irish (12.9%, a difference of 0.30%).
| Demographics | Rating | Rank | Disability |
| Finns | 0.0 /100 | #273 | Tragic 12.7% |
| Nepalese | 0.0 /100 | #274 | Tragic 12.8% |
| Sioux | 0.0 /100 | #275 | Tragic 12.8% |
| Hmong | 0.0 /100 | #276 | Tragic 12.8% |
| Dutch | 0.0 /100 | #277 | Tragic 12.8% |
| Germans | 0.0 /100 | #278 | Tragic 12.8% |
| Fijians | 0.0 /100 | #279 | Tragic 12.8% |
| Spanish | 0.0 /100 | #280 | Tragic 12.8% |
| Immigrants | Portugal | 0.0 /100 | #281 | Tragic 12.9% |
| Scottish | 0.0 /100 | #282 | Tragic 12.9% |
| Irish | 0.0 /100 | #283 | Tragic 12.9% |
| Welsh | 0.0 /100 | #284 | Tragic 12.9% |
| Crow | 0.0 /100 | #285 | Tragic 12.9% |
| English | 0.0 /100 | #286 | Tragic 13.0% |
| Africans | 0.0 /100 | #287 | Tragic 13.0% |