Immigrants from Nepal vs Spanish Disability
COMPARE
Immigrants from Nepal
Spanish
Disability
Disability Comparison
Immigrants from Nepal
Spanish
10.8%
DISABILITY
99.9/ 100
METRIC RATING
42nd/ 347
METRIC RANK
12.8%
DISABILITY
0.0/ 100
METRIC RATING
280th/ 347
METRIC RANK
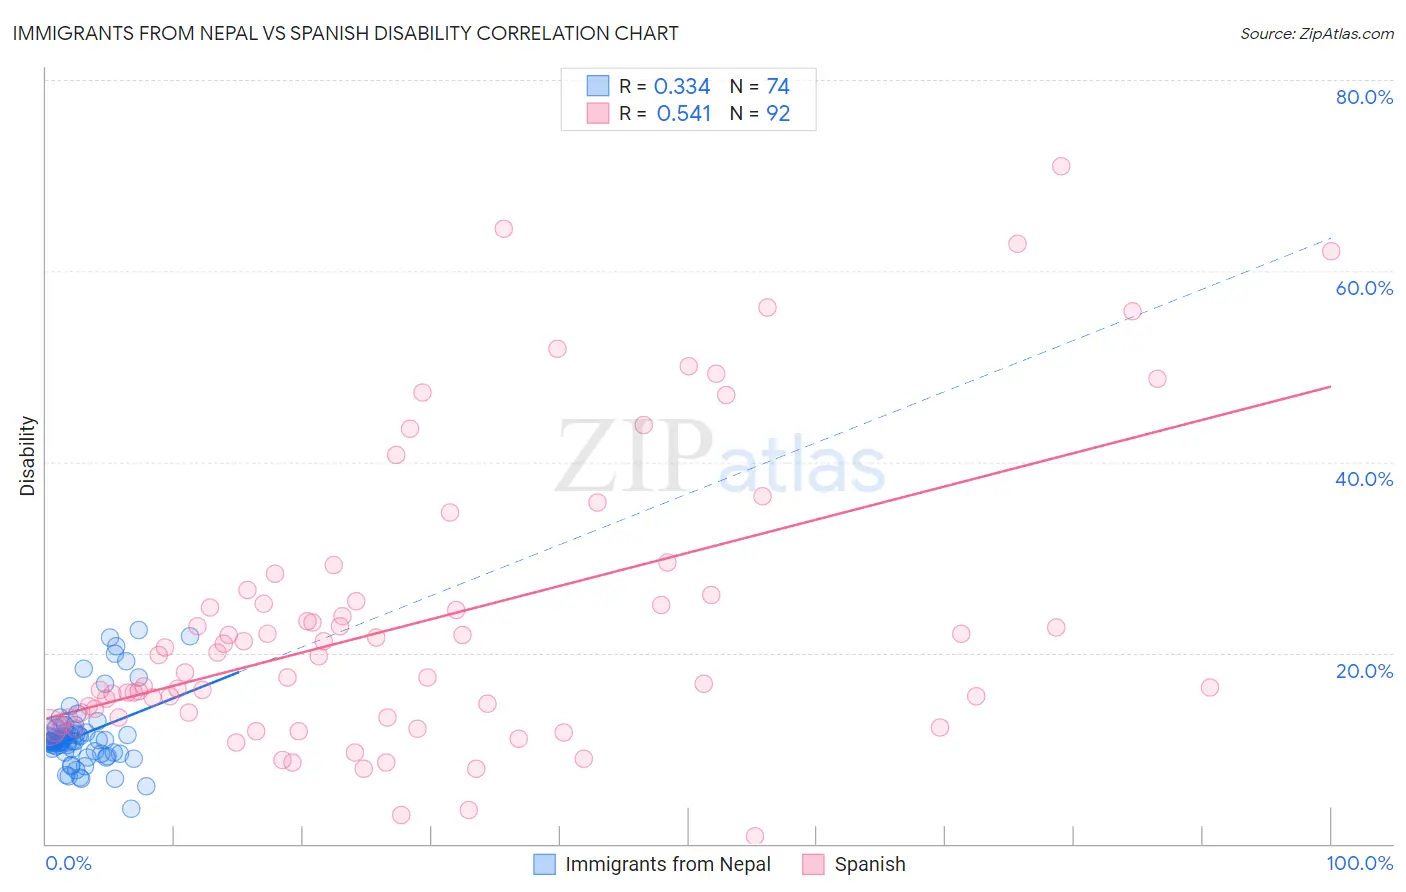
Immigrants from Nepal vs Spanish Disability Correlation Chart
The statistical analysis conducted on geographies consisting of 186,790,977 people shows a mild positive correlation between the proportion of Immigrants from Nepal and percentage of population with a disability in the United States with a correlation coefficient (R) of 0.334 and weighted average of 10.8%. Similarly, the statistical analysis conducted on geographies consisting of 422,113,080 people shows a substantial positive correlation between the proportion of Spanish and percentage of population with a disability in the United States with a correlation coefficient (R) of 0.541 and weighted average of 12.8%, a difference of 19.1%.
Disability Correlation Summary
| Measurement | Immigrants from Nepal | Spanish |
| Minimum | 3.7% | 0.84% |
| Maximum | 22.3% | 71.0% |
| Range | 18.7% | 70.1% |
| Mean | 11.4% | 23.3% |
| Median | 10.8% | 18.8% |
| Interquartile 25% (IQ1) | 9.6% | 13.2% |
| Interquartile 75% (IQ3) | 11.9% | 25.7% |
| Interquartile Range (IQR) | 2.3% | 12.5% |
| Standard Deviation (Sample) | 3.7% | 15.1% |
| Standard Deviation (Population) | 3.6% | 15.0% |
Similar Demographics by Disability
Demographics Similar to Immigrants from Nepal by Disability
In terms of disability, the demographic groups most similar to Immigrants from Nepal are Israeli (10.8%, a difference of 0.050%), Immigrants from Australia (10.8%, a difference of 0.10%), Cambodian (10.8%, a difference of 0.14%), Mongolian (10.8%, a difference of 0.14%), and Immigrants from Japan (10.8%, a difference of 0.15%).
| Demographics | Rating | Rank | Disability |
| Immigrants | Indonesia | 100.0 /100 | #35 | Exceptional 10.7% |
| Ethiopians | 100.0 /100 | #36 | Exceptional 10.7% |
| Turks | 100.0 /100 | #37 | Exceptional 10.7% |
| Afghans | 99.9 /100 | #38 | Exceptional 10.8% |
| Cambodians | 99.9 /100 | #39 | Exceptional 10.8% |
| Mongolians | 99.9 /100 | #40 | Exceptional 10.8% |
| Immigrants | Australia | 99.9 /100 | #41 | Exceptional 10.8% |
| Immigrants | Nepal | 99.9 /100 | #42 | Exceptional 10.8% |
| Israelis | 99.9 /100 | #43 | Exceptional 10.8% |
| Immigrants | Japan | 99.9 /100 | #44 | Exceptional 10.8% |
| Immigrants | Peru | 99.9 /100 | #45 | Exceptional 10.8% |
| Tongans | 99.9 /100 | #46 | Exceptional 10.8% |
| Taiwanese | 99.9 /100 | #47 | Exceptional 10.8% |
| Soviet Union | 99.9 /100 | #48 | Exceptional 10.9% |
| Vietnamese | 99.9 /100 | #49 | Exceptional 10.9% |
Demographics Similar to Spanish by Disability
In terms of disability, the demographic groups most similar to Spanish are Fijian (12.8%, a difference of 0.050%), Immigrants from Portugal (12.9%, a difference of 0.14%), German (12.8%, a difference of 0.15%), Scottish (12.9%, a difference of 0.28%), and Irish (12.9%, a difference of 0.30%).
| Demographics | Rating | Rank | Disability |
| Finns | 0.0 /100 | #273 | Tragic 12.7% |
| Nepalese | 0.0 /100 | #274 | Tragic 12.8% |
| Sioux | 0.0 /100 | #275 | Tragic 12.8% |
| Hmong | 0.0 /100 | #276 | Tragic 12.8% |
| Dutch | 0.0 /100 | #277 | Tragic 12.8% |
| Germans | 0.0 /100 | #278 | Tragic 12.8% |
| Fijians | 0.0 /100 | #279 | Tragic 12.8% |
| Spanish | 0.0 /100 | #280 | Tragic 12.8% |
| Immigrants | Portugal | 0.0 /100 | #281 | Tragic 12.9% |
| Scottish | 0.0 /100 | #282 | Tragic 12.9% |
| Irish | 0.0 /100 | #283 | Tragic 12.9% |
| Welsh | 0.0 /100 | #284 | Tragic 12.9% |
| Crow | 0.0 /100 | #285 | Tragic 12.9% |
| English | 0.0 /100 | #286 | Tragic 13.0% |
| Africans | 0.0 /100 | #287 | Tragic 13.0% |