Samoan vs Choctaw Hearing Disability
COMPARE
Samoan
Choctaw
Hearing Disability
Hearing Disability Comparison
Samoans
Choctaw
3.3%
HEARING DISABILITY
1.1/ 100
METRIC RATING
241st/ 347
METRIC RANK
4.5%
HEARING DISABILITY
0.0/ 100
METRIC RATING
339th/ 347
METRIC RANK
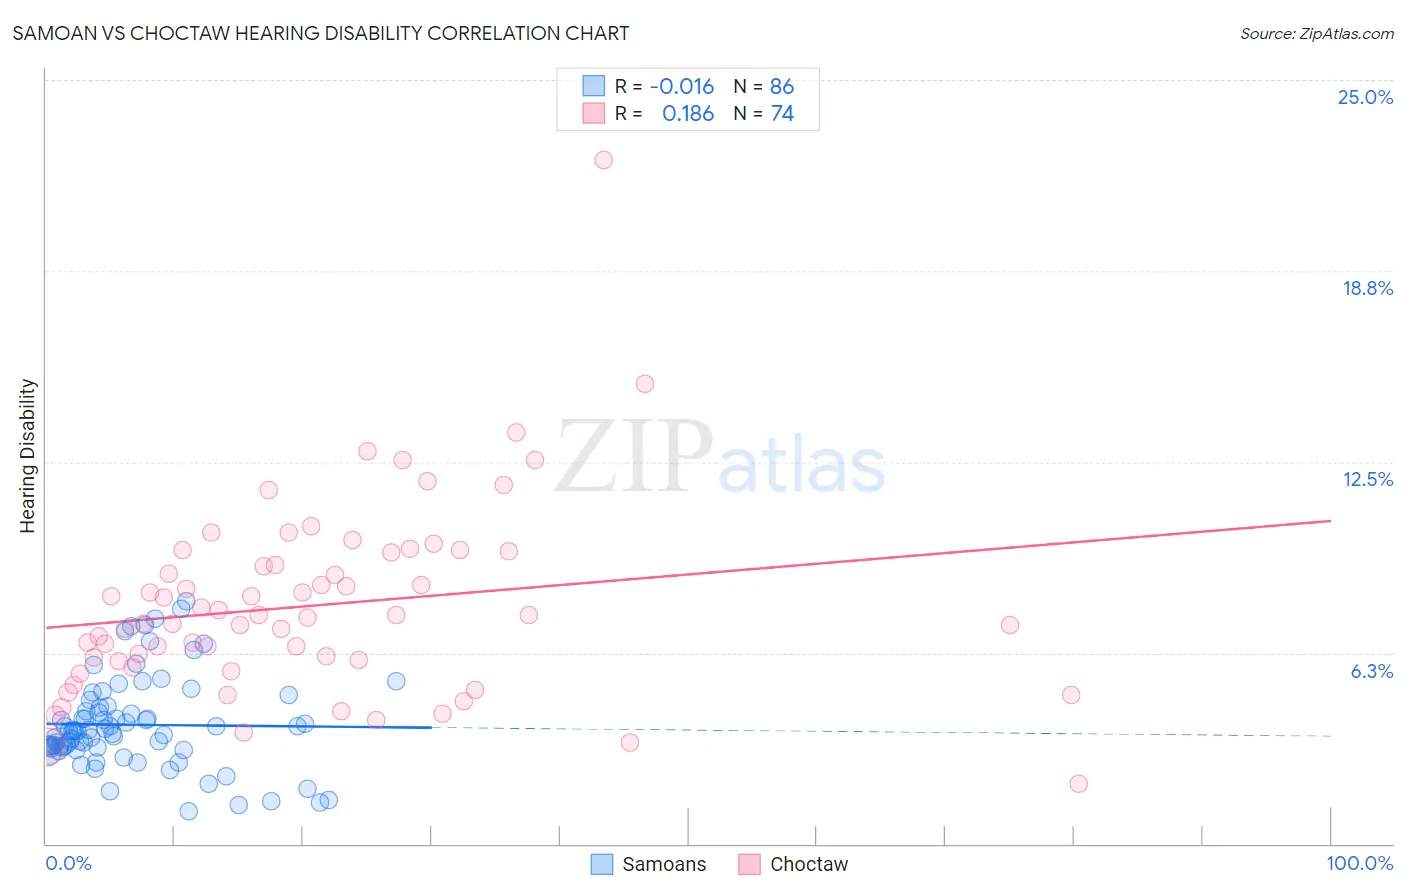
Samoan vs Choctaw Hearing Disability Correlation Chart
The statistical analysis conducted on geographies consisting of 225,100,241 people shows no correlation between the proportion of Samoans and percentage of population with hearing disability in the United States with a correlation coefficient (R) of -0.016 and weighted average of 3.3%. Similarly, the statistical analysis conducted on geographies consisting of 269,646,224 people shows a poor positive correlation between the proportion of Choctaw and percentage of population with hearing disability in the United States with a correlation coefficient (R) of 0.186 and weighted average of 4.5%, a difference of 37.3%.
Hearing Disability Correlation Summary
| Measurement | Samoan | Choctaw |
| Minimum | 1.1% | 1.9% |
| Maximum | 8.0% | 22.4% |
| Range | 6.9% | 20.4% |
| Mean | 3.9% | 7.8% |
| Median | 3.7% | 7.4% |
| Interquartile 25% (IQ1) | 3.1% | 6.0% |
| Interquartile 75% (IQ3) | 4.5% | 9.5% |
| Interquartile Range (IQR) | 1.3% | 3.6% |
| Standard Deviation (Sample) | 1.5% | 3.1% |
| Standard Deviation (Population) | 1.5% | 3.1% |
Similar Demographics by Hearing Disability
Demographics Similar to Samoans by Hearing Disability
In terms of hearing disability, the demographic groups most similar to Samoans are Immigrants from Netherlands (3.3%, a difference of 0.070%), Yugoslavian (3.3%, a difference of 0.11%), Nepalese (3.3%, a difference of 0.25%), Immigrants from Western Europe (3.3%, a difference of 0.28%), and Assyrian/Chaldean/Syriac (3.3%, a difference of 0.35%).
| Demographics | Rating | Rank | Hearing Disability |
| Central American Indians | 2.3 /100 | #234 | Tragic 3.3% |
| Guamanians/Chamorros | 2.2 /100 | #235 | Tragic 3.3% |
| Serbians | 2.2 /100 | #236 | Tragic 3.3% |
| Immigrants | Austria | 1.8 /100 | #237 | Tragic 3.3% |
| German Russians | 1.8 /100 | #238 | Tragic 3.3% |
| Nepalese | 1.2 /100 | #239 | Tragic 3.3% |
| Immigrants | Netherlands | 1.1 /100 | #240 | Tragic 3.3% |
| Samoans | 1.1 /100 | #241 | Tragic 3.3% |
| Yugoslavians | 1.0 /100 | #242 | Tragic 3.3% |
| Immigrants | Western Europe | 1.0 /100 | #243 | Tragic 3.3% |
| Assyrians/Chaldeans/Syriacs | 0.9 /100 | #244 | Tragic 3.3% |
| Immigrants | Scotland | 0.8 /100 | #245 | Tragic 3.3% |
| Immigrants | England | 0.7 /100 | #246 | Tragic 3.3% |
| Lithuanians | 0.6 /100 | #247 | Tragic 3.4% |
| Austrians | 0.6 /100 | #248 | Tragic 3.4% |
Demographics Similar to Choctaw by Hearing Disability
In terms of hearing disability, the demographic groups most similar to Choctaw are Alaska Native (4.5%, a difference of 1.4%), Pueblo (4.6%, a difference of 1.5%), Chickasaw (4.5%, a difference of 1.6%), Navajo (4.6%, a difference of 1.8%), and Tsimshian (4.7%, a difference of 3.4%).
| Demographics | Rating | Rank | Hearing Disability |
| Houma | 0.0 /100 | #332 | Tragic 4.2% |
| Dutch West Indians | 0.0 /100 | #333 | Tragic 4.3% |
| Aleuts | 0.0 /100 | #334 | Tragic 4.3% |
| Kiowa | 0.0 /100 | #335 | Tragic 4.3% |
| Creek | 0.0 /100 | #336 | Tragic 4.4% |
| Chickasaw | 0.0 /100 | #337 | Tragic 4.5% |
| Alaska Natives | 0.0 /100 | #338 | Tragic 4.5% |
| Choctaw | 0.0 /100 | #339 | Tragic 4.5% |
| Pueblo | 0.0 /100 | #340 | Tragic 4.6% |
| Navajo | 0.0 /100 | #341 | Tragic 4.6% |
| Tsimshian | 0.0 /100 | #342 | Tragic 4.7% |
| Inupiat | 0.0 /100 | #343 | Tragic 4.7% |
| Tlingit-Haida | 0.0 /100 | #344 | Tragic 4.8% |
| Alaskan Athabascans | 0.0 /100 | #345 | Tragic 5.3% |
| Colville | 0.0 /100 | #346 | Tragic 5.3% |