European vs Choctaw Hearing Disability
COMPARE
European
Choctaw
Hearing Disability
Hearing Disability Comparison
Europeans
Choctaw
3.5%
HEARING DISABILITY
0.1/ 100
METRIC RATING
270th/ 347
METRIC RANK
4.5%
HEARING DISABILITY
0.0/ 100
METRIC RATING
339th/ 347
METRIC RANK
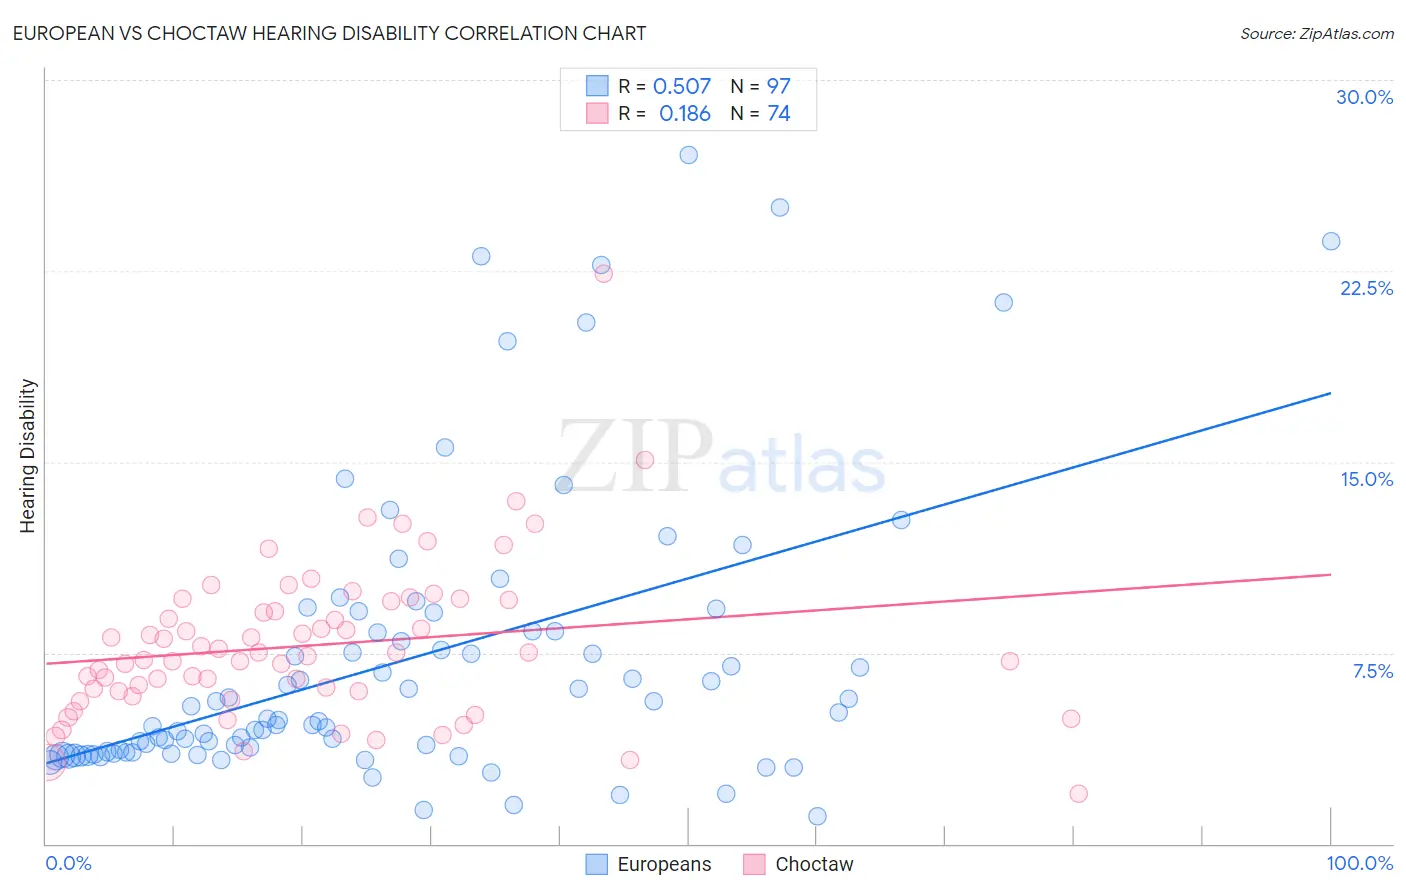
European vs Choctaw Hearing Disability Correlation Chart
The statistical analysis conducted on geographies consisting of 561,261,732 people shows a substantial positive correlation between the proportion of Europeans and percentage of population with hearing disability in the United States with a correlation coefficient (R) of 0.507 and weighted average of 3.5%. Similarly, the statistical analysis conducted on geographies consisting of 269,646,224 people shows a poor positive correlation between the proportion of Choctaw and percentage of population with hearing disability in the United States with a correlation coefficient (R) of 0.186 and weighted average of 4.5%, a difference of 29.6%.
Hearing Disability Correlation Summary
| Measurement | European | Choctaw |
| Minimum | 1.1% | 1.9% |
| Maximum | 27.1% | 22.4% |
| Range | 26.0% | 20.4% |
| Mean | 7.2% | 7.8% |
| Median | 4.8% | 7.4% |
| Interquartile 25% (IQ1) | 3.6% | 6.0% |
| Interquartile 75% (IQ3) | 8.3% | 9.5% |
| Interquartile Range (IQR) | 4.8% | 3.6% |
| Standard Deviation (Sample) | 5.6% | 3.1% |
| Standard Deviation (Population) | 5.6% | 3.1% |
Similar Demographics by Hearing Disability
Demographics Similar to Europeans by Hearing Disability
In terms of hearing disability, the demographic groups most similar to Europeans are Czech (3.5%, a difference of 0.26%), Ute (3.5%, a difference of 0.35%), Fijian (3.5%, a difference of 0.52%), Puerto Rican (3.5%, a difference of 0.59%), and Spaniard (3.5%, a difference of 0.65%).
| Demographics | Rating | Rank | Hearing Disability |
| Immigrants | Canada | 0.1 /100 | #263 | Tragic 3.5% |
| Immigrants | Germany | 0.1 /100 | #264 | Tragic 3.5% |
| British | 0.1 /100 | #265 | Tragic 3.5% |
| Belgians | 0.1 /100 | #266 | Tragic 3.5% |
| Canadians | 0.1 /100 | #267 | Tragic 3.5% |
| Spaniards | 0.1 /100 | #268 | Tragic 3.5% |
| Ute | 0.1 /100 | #269 | Tragic 3.5% |
| Europeans | 0.1 /100 | #270 | Tragic 3.5% |
| Czechs | 0.1 /100 | #271 | Tragic 3.5% |
| Fijians | 0.0 /100 | #272 | Tragic 3.5% |
| Puerto Ricans | 0.0 /100 | #273 | Tragic 3.5% |
| Swiss | 0.0 /100 | #274 | Tragic 3.5% |
| Czechoslovakians | 0.0 /100 | #275 | Tragic 3.6% |
| Danes | 0.0 /100 | #276 | Tragic 3.6% |
| Immigrants | Nonimmigrants | 0.0 /100 | #277 | Tragic 3.6% |
Demographics Similar to Choctaw by Hearing Disability
In terms of hearing disability, the demographic groups most similar to Choctaw are Alaska Native (4.5%, a difference of 1.4%), Pueblo (4.6%, a difference of 1.5%), Chickasaw (4.5%, a difference of 1.6%), Navajo (4.6%, a difference of 1.8%), and Tsimshian (4.7%, a difference of 3.4%).
| Demographics | Rating | Rank | Hearing Disability |
| Houma | 0.0 /100 | #332 | Tragic 4.2% |
| Dutch West Indians | 0.0 /100 | #333 | Tragic 4.3% |
| Aleuts | 0.0 /100 | #334 | Tragic 4.3% |
| Kiowa | 0.0 /100 | #335 | Tragic 4.3% |
| Creek | 0.0 /100 | #336 | Tragic 4.4% |
| Chickasaw | 0.0 /100 | #337 | Tragic 4.5% |
| Alaska Natives | 0.0 /100 | #338 | Tragic 4.5% |
| Choctaw | 0.0 /100 | #339 | Tragic 4.5% |
| Pueblo | 0.0 /100 | #340 | Tragic 4.6% |
| Navajo | 0.0 /100 | #341 | Tragic 4.6% |
| Tsimshian | 0.0 /100 | #342 | Tragic 4.7% |
| Inupiat | 0.0 /100 | #343 | Tragic 4.7% |
| Tlingit-Haida | 0.0 /100 | #344 | Tragic 4.8% |
| Alaskan Athabascans | 0.0 /100 | #345 | Tragic 5.3% |
| Colville | 0.0 /100 | #346 | Tragic 5.3% |