Samoan vs Polish Hearing Disability
COMPARE
Samoan
Polish
Hearing Disability
Hearing Disability Comparison
Samoans
Poles
3.3%
HEARING DISABILITY
1.1/ 100
METRIC RATING
241st/ 347
METRIC RANK
3.4%
HEARING DISABILITY
0.2/ 100
METRIC RATING
255th/ 347
METRIC RANK
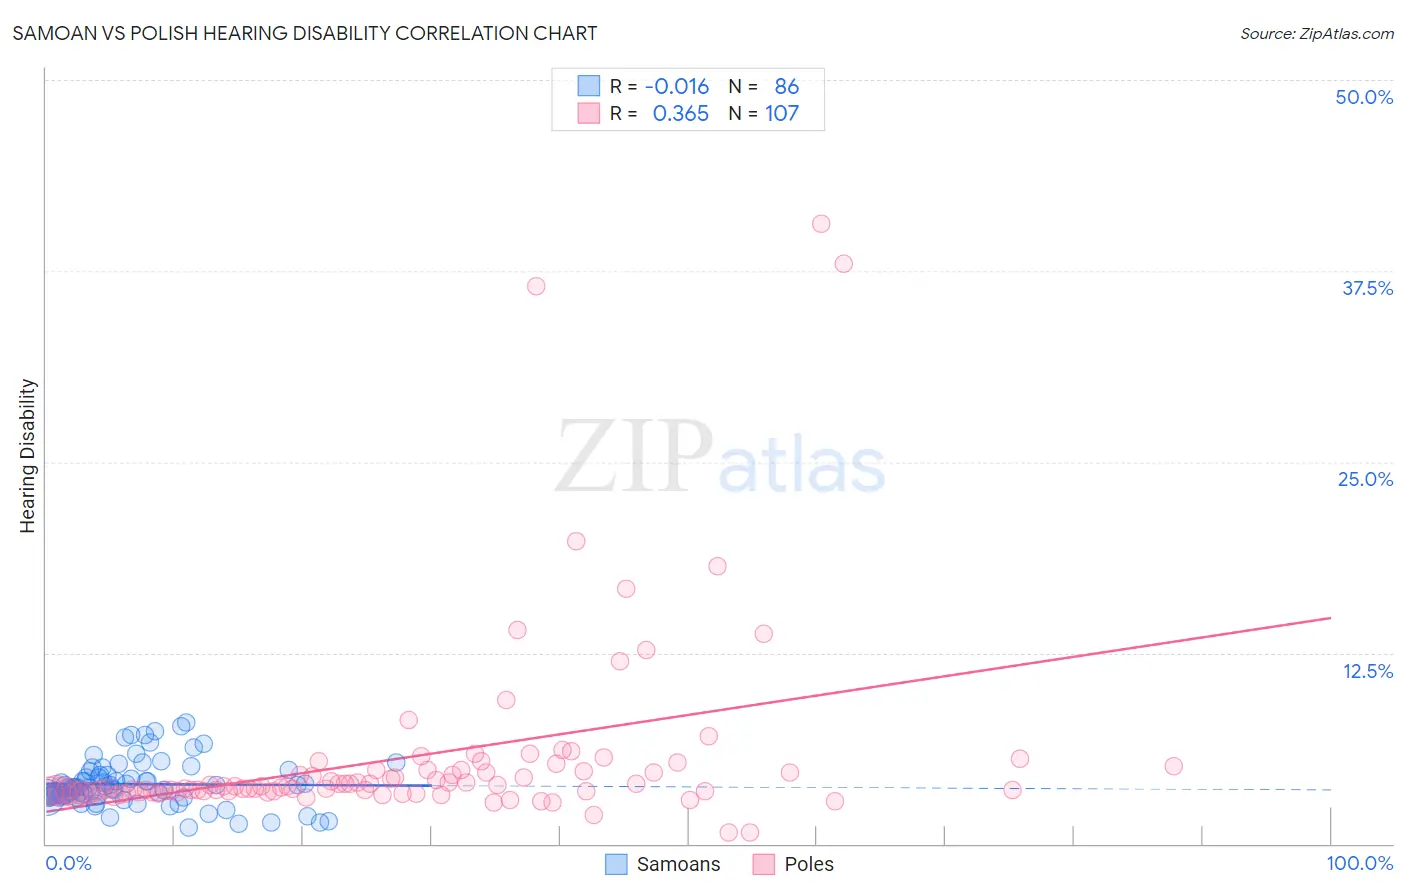
Samoan vs Polish Hearing Disability Correlation Chart
The statistical analysis conducted on geographies consisting of 225,100,241 people shows no correlation between the proportion of Samoans and percentage of population with hearing disability in the United States with a correlation coefficient (R) of -0.016 and weighted average of 3.3%. Similarly, the statistical analysis conducted on geographies consisting of 559,927,295 people shows a mild positive correlation between the proportion of Poles and percentage of population with hearing disability in the United States with a correlation coefficient (R) of 0.365 and weighted average of 3.4%, a difference of 3.5%.
Hearing Disability Correlation Summary
| Measurement | Samoan | Polish |
| Minimum | 1.1% | 0.74% |
| Maximum | 8.0% | 40.6% |
| Range | 6.9% | 39.8% |
| Mean | 3.9% | 5.7% |
| Median | 3.7% | 3.7% |
| Interquartile 25% (IQ1) | 3.1% | 3.4% |
| Interquartile 75% (IQ3) | 4.5% | 4.8% |
| Interquartile Range (IQR) | 1.3% | 1.4% |
| Standard Deviation (Sample) | 1.5% | 6.4% |
| Standard Deviation (Population) | 1.5% | 6.4% |
Demographics Similar to Samoans and Poles by Hearing Disability
In terms of hearing disability, the demographic groups most similar to Samoans are Immigrants from Netherlands (3.3%, a difference of 0.070%), Yugoslavian (3.3%, a difference of 0.11%), Nepalese (3.3%, a difference of 0.25%), Immigrants from Western Europe (3.3%, a difference of 0.28%), and Assyrian/Chaldean/Syriac (3.3%, a difference of 0.35%). Similarly, the demographic groups most similar to Poles are Hmong (3.4%, a difference of 0.040%), Slavic (3.4%, a difference of 0.23%), Yaqui (3.4%, a difference of 0.49%), Northern European (3.4%, a difference of 0.56%), and Carpatho Rusyn (3.4%, a difference of 0.65%).
| Demographics | Rating | Rank | Hearing Disability |
| German Russians | 1.8 /100 | #238 | Tragic 3.3% |
| Nepalese | 1.2 /100 | #239 | Tragic 3.3% |
| Immigrants | Netherlands | 1.1 /100 | #240 | Tragic 3.3% |
| Samoans | 1.1 /100 | #241 | Tragic 3.3% |
| Yugoslavians | 1.0 /100 | #242 | Tragic 3.3% |
| Immigrants | Western Europe | 1.0 /100 | #243 | Tragic 3.3% |
| Assyrians/Chaldeans/Syriacs | 0.9 /100 | #244 | Tragic 3.3% |
| Immigrants | Scotland | 0.8 /100 | #245 | Tragic 3.3% |
| Immigrants | England | 0.7 /100 | #246 | Tragic 3.3% |
| Lithuanians | 0.6 /100 | #247 | Tragic 3.4% |
| Austrians | 0.6 /100 | #248 | Tragic 3.4% |
| Italians | 0.4 /100 | #249 | Tragic 3.4% |
| Yuman | 0.4 /100 | #250 | Tragic 3.4% |
| Hungarians | 0.4 /100 | #251 | Tragic 3.4% |
| Croatians | 0.4 /100 | #252 | Tragic 3.4% |
| Carpatho Rusyns | 0.3 /100 | #253 | Tragic 3.4% |
| Slavs | 0.2 /100 | #254 | Tragic 3.4% |
| Poles | 0.2 /100 | #255 | Tragic 3.4% |
| Hmong | 0.2 /100 | #256 | Tragic 3.4% |
| Yaqui | 0.2 /100 | #257 | Tragic 3.4% |
| Northern Europeans | 0.2 /100 | #258 | Tragic 3.4% |