Inupiat vs Choctaw Hearing Disability
COMPARE
Inupiat
Choctaw
Hearing Disability
Hearing Disability Comparison
Inupiat
Choctaw
4.7%
HEARING DISABILITY
0.0/ 100
METRIC RATING
343rd/ 347
METRIC RANK
4.5%
HEARING DISABILITY
0.0/ 100
METRIC RATING
339th/ 347
METRIC RANK
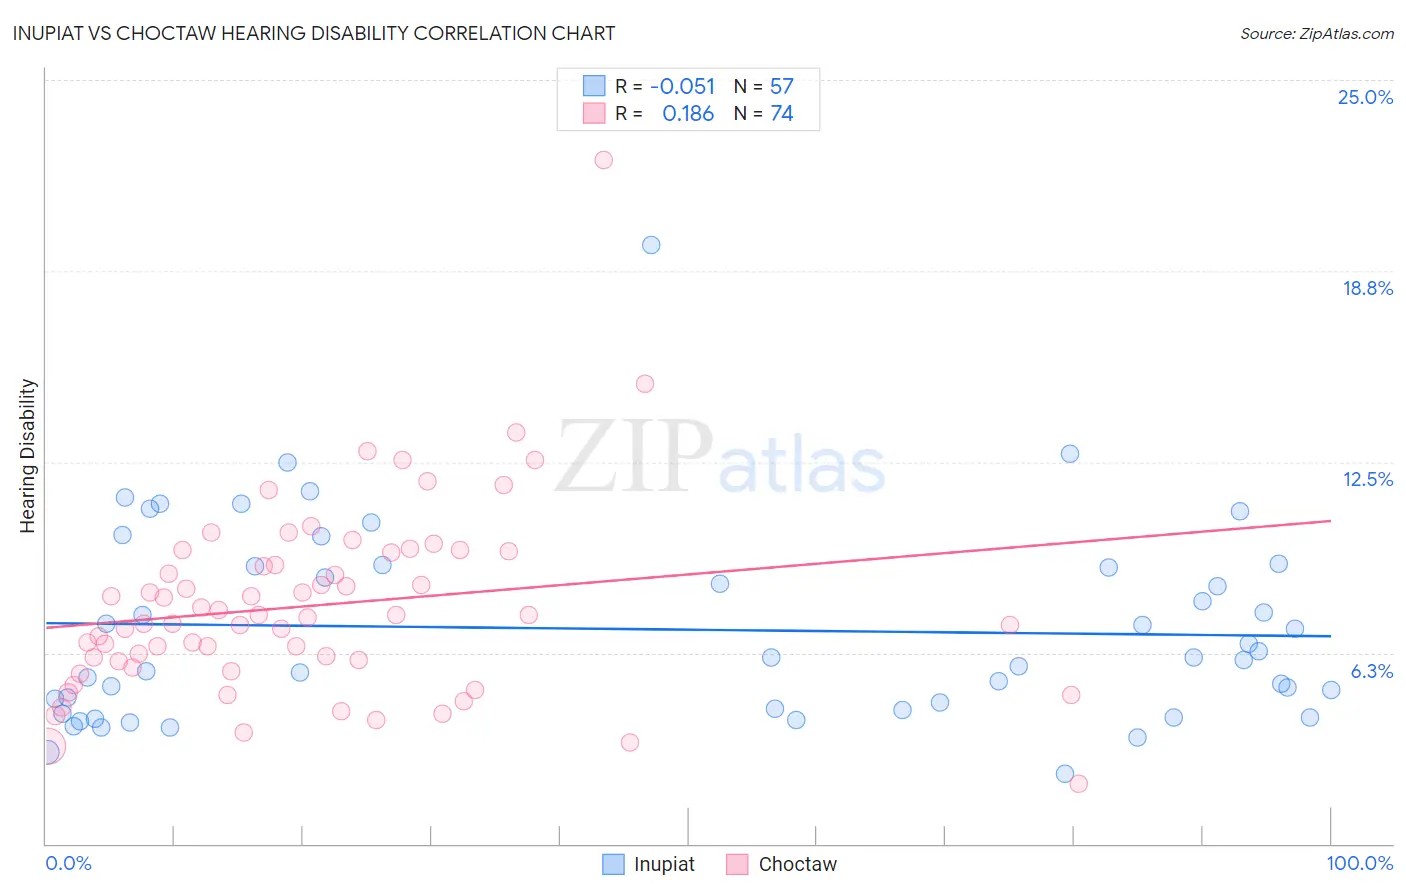
Inupiat vs Choctaw Hearing Disability Correlation Chart
The statistical analysis conducted on geographies consisting of 96,332,419 people shows a slight negative correlation between the proportion of Inupiat and percentage of population with hearing disability in the United States with a correlation coefficient (R) of -0.051 and weighted average of 4.7%. Similarly, the statistical analysis conducted on geographies consisting of 269,646,224 people shows a poor positive correlation between the proportion of Choctaw and percentage of population with hearing disability in the United States with a correlation coefficient (R) of 0.186 and weighted average of 4.5%, a difference of 3.6%.
Hearing Disability Correlation Summary
| Measurement | Inupiat | Choctaw |
| Minimum | 2.3% | 1.9% |
| Maximum | 19.6% | 22.4% |
| Range | 17.3% | 20.4% |
| Mean | 7.0% | 7.8% |
| Median | 6.1% | 7.4% |
| Interquartile 25% (IQ1) | 4.4% | 6.0% |
| Interquartile 75% (IQ3) | 9.1% | 9.5% |
| Interquartile Range (IQR) | 4.7% | 3.6% |
| Standard Deviation (Sample) | 3.2% | 3.1% |
| Standard Deviation (Population) | 3.2% | 3.1% |
Demographics Similar to Inupiat and Choctaw by Hearing Disability
In terms of hearing disability, the demographic groups most similar to Inupiat are Tsimshian (4.7%, a difference of 0.21%), Navajo (4.6%, a difference of 1.8%), Pueblo (4.6%, a difference of 2.1%), Tlingit-Haida (4.8%, a difference of 2.7%), and Alaska Native (4.5%, a difference of 5.1%). Similarly, the demographic groups most similar to Choctaw are Alaska Native (4.5%, a difference of 1.4%), Pueblo (4.6%, a difference of 1.5%), Chickasaw (4.5%, a difference of 1.6%), Navajo (4.6%, a difference of 1.8%), and Tsimshian (4.7%, a difference of 3.4%).
| Demographics | Rating | Rank | Hearing Disability |
| Tohono O'odham | 0.0 /100 | #328 | Tragic 4.2% |
| Crow | 0.0 /100 | #329 | Tragic 4.2% |
| Natives/Alaskans | 0.0 /100 | #330 | Tragic 4.2% |
| Cherokee | 0.0 /100 | #331 | Tragic 4.2% |
| Houma | 0.0 /100 | #332 | Tragic 4.2% |
| Dutch West Indians | 0.0 /100 | #333 | Tragic 4.3% |
| Aleuts | 0.0 /100 | #334 | Tragic 4.3% |
| Kiowa | 0.0 /100 | #335 | Tragic 4.3% |
| Creek | 0.0 /100 | #336 | Tragic 4.4% |
| Chickasaw | 0.0 /100 | #337 | Tragic 4.5% |
| Alaska Natives | 0.0 /100 | #338 | Tragic 4.5% |
| Choctaw | 0.0 /100 | #339 | Tragic 4.5% |
| Pueblo | 0.0 /100 | #340 | Tragic 4.6% |
| Navajo | 0.0 /100 | #341 | Tragic 4.6% |
| Tsimshian | 0.0 /100 | #342 | Tragic 4.7% |
| Inupiat | 0.0 /100 | #343 | Tragic 4.7% |
| Tlingit-Haida | 0.0 /100 | #344 | Tragic 4.8% |
| Alaskan Athabascans | 0.0 /100 | #345 | Tragic 5.3% |
| Colville | 0.0 /100 | #346 | Tragic 5.3% |
| Yup'ik | 0.0 /100 | #347 | Tragic 5.8% |