Samoan vs Immigrants from Afghanistan Hearing Disability
COMPARE
Samoan
Immigrants from Afghanistan
Hearing Disability
Hearing Disability Comparison
Samoans
Immigrants from Afghanistan
3.3%
HEARING DISABILITY
1.1/ 100
METRIC RATING
241st/ 347
METRIC RANK
2.8%
HEARING DISABILITY
95.3/ 100
METRIC RATING
97th/ 347
METRIC RANK
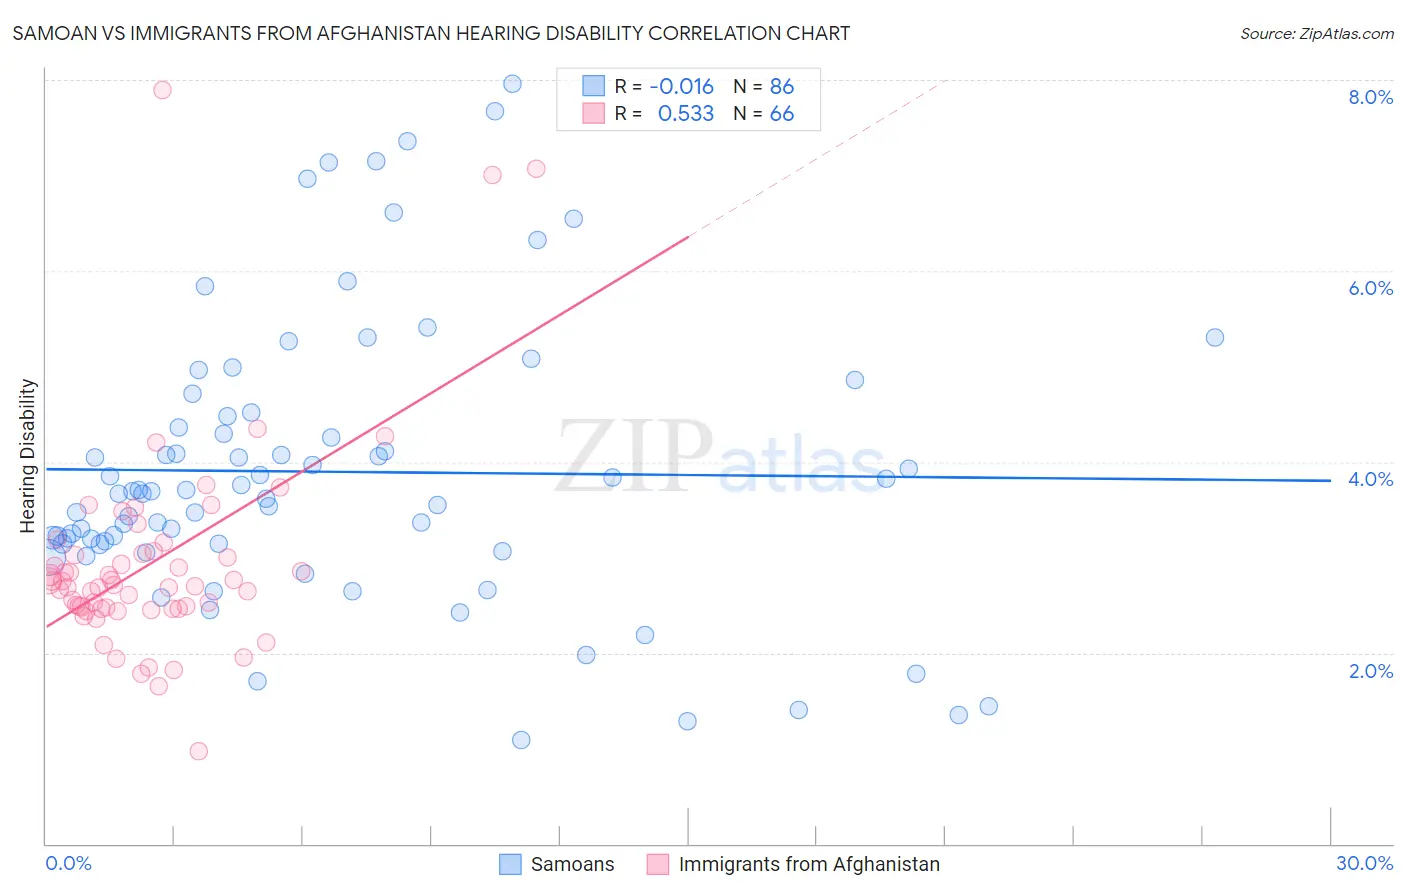
Samoan vs Immigrants from Afghanistan Hearing Disability Correlation Chart
The statistical analysis conducted on geographies consisting of 225,100,241 people shows no correlation between the proportion of Samoans and percentage of population with hearing disability in the United States with a correlation coefficient (R) of -0.016 and weighted average of 3.3%. Similarly, the statistical analysis conducted on geographies consisting of 147,605,800 people shows a substantial positive correlation between the proportion of Immigrants from Afghanistan and percentage of population with hearing disability in the United States with a correlation coefficient (R) of 0.533 and weighted average of 2.8%, a difference of 19.0%.
Hearing Disability Correlation Summary
| Measurement | Samoan | Immigrants from Afghanistan |
| Minimum | 1.1% | 0.97% |
| Maximum | 8.0% | 7.9% |
| Range | 6.9% | 6.9% |
| Mean | 3.9% | 2.9% |
| Median | 3.7% | 2.7% |
| Interquartile 25% (IQ1) | 3.1% | 2.5% |
| Interquartile 75% (IQ3) | 4.5% | 3.0% |
| Interquartile Range (IQR) | 1.3% | 0.57% |
| Standard Deviation (Sample) | 1.5% | 1.1% |
| Standard Deviation (Population) | 1.5% | 1.1% |
Similar Demographics by Hearing Disability
Demographics Similar to Samoans by Hearing Disability
In terms of hearing disability, the demographic groups most similar to Samoans are Immigrants from Netherlands (3.3%, a difference of 0.070%), Yugoslavian (3.3%, a difference of 0.11%), Nepalese (3.3%, a difference of 0.25%), Immigrants from Western Europe (3.3%, a difference of 0.28%), and Assyrian/Chaldean/Syriac (3.3%, a difference of 0.35%).
| Demographics | Rating | Rank | Hearing Disability |
| Central American Indians | 2.3 /100 | #234 | Tragic 3.3% |
| Guamanians/Chamorros | 2.2 /100 | #235 | Tragic 3.3% |
| Serbians | 2.2 /100 | #236 | Tragic 3.3% |
| Immigrants | Austria | 1.8 /100 | #237 | Tragic 3.3% |
| German Russians | 1.8 /100 | #238 | Tragic 3.3% |
| Nepalese | 1.2 /100 | #239 | Tragic 3.3% |
| Immigrants | Netherlands | 1.1 /100 | #240 | Tragic 3.3% |
| Samoans | 1.1 /100 | #241 | Tragic 3.3% |
| Yugoslavians | 1.0 /100 | #242 | Tragic 3.3% |
| Immigrants | Western Europe | 1.0 /100 | #243 | Tragic 3.3% |
| Assyrians/Chaldeans/Syriacs | 0.9 /100 | #244 | Tragic 3.3% |
| Immigrants | Scotland | 0.8 /100 | #245 | Tragic 3.3% |
| Immigrants | England | 0.7 /100 | #246 | Tragic 3.3% |
| Lithuanians | 0.6 /100 | #247 | Tragic 3.4% |
| Austrians | 0.6 /100 | #248 | Tragic 3.4% |
Demographics Similar to Immigrants from Afghanistan by Hearing Disability
In terms of hearing disability, the demographic groups most similar to Immigrants from Afghanistan are Immigrants from Honduras (2.8%, a difference of 0.060%), Immigrants from Guatemala (2.8%, a difference of 0.10%), Immigrants from Eastern Africa (2.8%, a difference of 0.15%), Immigrants from Somalia (2.8%, a difference of 0.17%), and Immigrants from Spain (2.8%, a difference of 0.21%).
| Demographics | Rating | Rank | Hearing Disability |
| Immigrants | Morocco | 96.6 /100 | #90 | Exceptional 2.8% |
| Immigrants | Middle Africa | 96.5 /100 | #91 | Exceptional 2.8% |
| Iranians | 96.4 /100 | #92 | Exceptional 2.8% |
| Immigrants | Kuwait | 96.3 /100 | #93 | Exceptional 2.8% |
| Uruguayans | 95.9 /100 | #94 | Exceptional 2.8% |
| Israelis | 95.9 /100 | #95 | Exceptional 2.8% |
| Immigrants | Somalia | 95.5 /100 | #96 | Exceptional 2.8% |
| Immigrants | Afghanistan | 95.3 /100 | #97 | Exceptional 2.8% |
| Immigrants | Honduras | 95.1 /100 | #98 | Exceptional 2.8% |
| Immigrants | Guatemala | 95.1 /100 | #99 | Exceptional 2.8% |
| Immigrants | Eastern Africa | 95.0 /100 | #100 | Exceptional 2.8% |
| Immigrants | Spain | 94.9 /100 | #101 | Exceptional 2.8% |
| Taiwanese | 94.8 /100 | #102 | Exceptional 2.8% |
| Immigrants | Indonesia | 94.7 /100 | #103 | Exceptional 2.8% |
| Burmese | 94.2 /100 | #104 | Exceptional 2.8% |