Immigrants from Armenia vs Choctaw Hearing Disability
COMPARE
Immigrants from Armenia
Choctaw
Hearing Disability
Hearing Disability Comparison
Immigrants from Armenia
Choctaw
2.7%
HEARING DISABILITY
97.2/ 100
METRIC RATING
82nd/ 347
METRIC RANK
4.5%
HEARING DISABILITY
0.0/ 100
METRIC RATING
339th/ 347
METRIC RANK
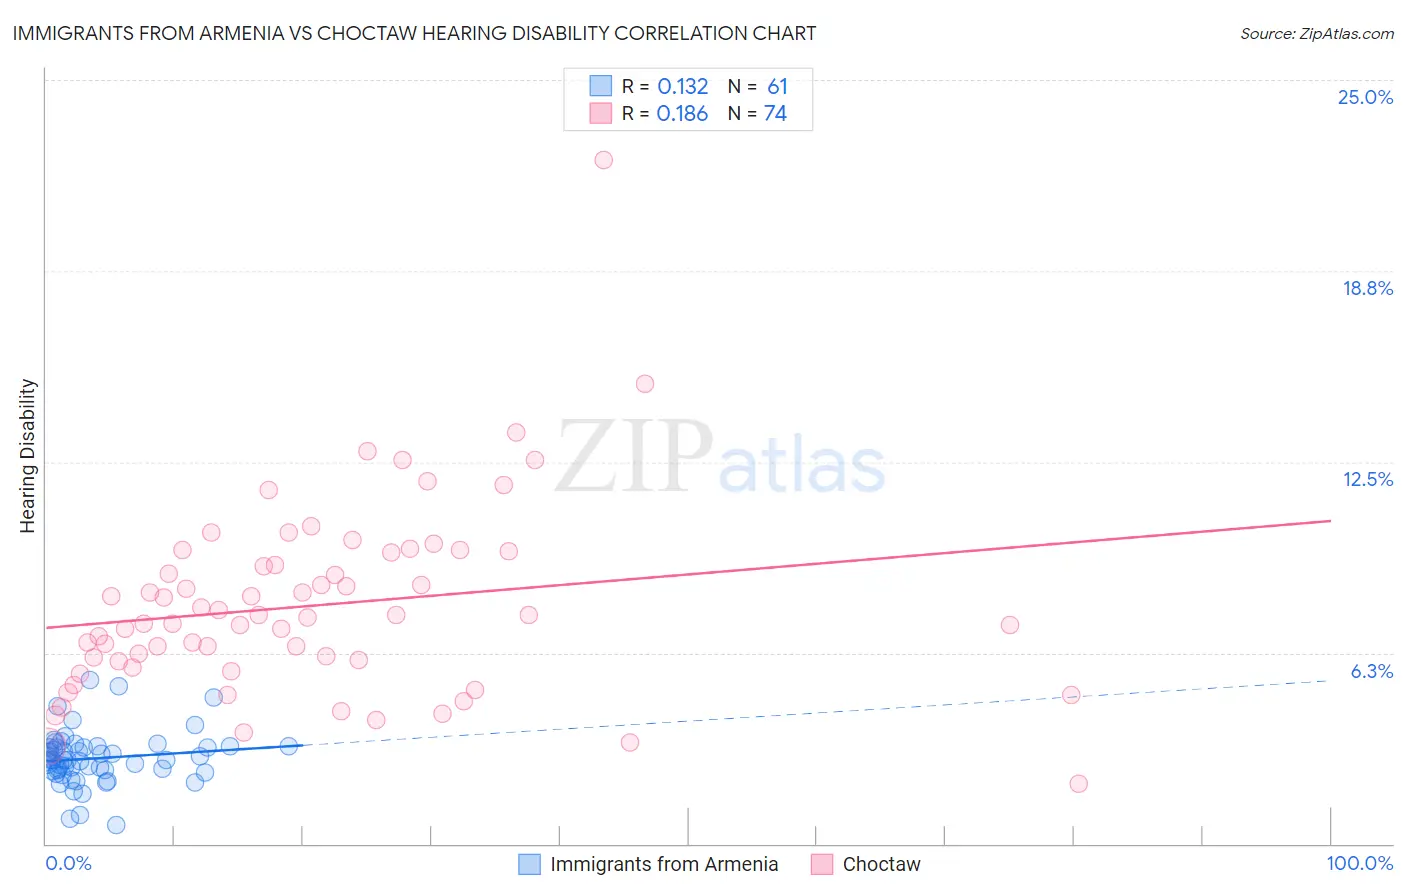
Immigrants from Armenia vs Choctaw Hearing Disability Correlation Chart
The statistical analysis conducted on geographies consisting of 97,707,768 people shows a poor positive correlation between the proportion of Immigrants from Armenia and percentage of population with hearing disability in the United States with a correlation coefficient (R) of 0.132 and weighted average of 2.7%. Similarly, the statistical analysis conducted on geographies consisting of 269,646,224 people shows a poor positive correlation between the proportion of Choctaw and percentage of population with hearing disability in the United States with a correlation coefficient (R) of 0.186 and weighted average of 4.5%, a difference of 65.7%.
Hearing Disability Correlation Summary
| Measurement | Immigrants from Armenia | Choctaw |
| Minimum | 0.60% | 1.9% |
| Maximum | 5.4% | 22.4% |
| Range | 4.8% | 20.4% |
| Mean | 2.8% | 7.8% |
| Median | 2.8% | 7.4% |
| Interquartile 25% (IQ1) | 2.4% | 6.0% |
| Interquartile 75% (IQ3) | 3.2% | 9.5% |
| Interquartile Range (IQR) | 0.77% | 3.6% |
| Standard Deviation (Sample) | 0.87% | 3.1% |
| Standard Deviation (Population) | 0.86% | 3.1% |
Similar Demographics by Hearing Disability
Demographics Similar to Immigrants from Armenia by Hearing Disability
In terms of hearing disability, the demographic groups most similar to Immigrants from Armenia are Immigrants from Uruguay (2.7%, a difference of 0.020%), Immigrants from Cuba (2.7%, a difference of 0.020%), Immigrants from Asia (2.7%, a difference of 0.050%), Immigrants from Argentina (2.8%, a difference of 0.21%), and Colombian (2.7%, a difference of 0.23%).
| Demographics | Rating | Rank | Hearing Disability |
| Immigrants | Saudi Arabia | 97.5 /100 | #75 | Exceptional 2.7% |
| Asians | 97.5 /100 | #76 | Exceptional 2.7% |
| Immigrants | Malaysia | 97.5 /100 | #77 | Exceptional 2.7% |
| Mongolians | 97.4 /100 | #78 | Exceptional 2.7% |
| Colombians | 97.4 /100 | #79 | Exceptional 2.7% |
| Immigrants | Asia | 97.2 /100 | #80 | Exceptional 2.7% |
| Immigrants | Uruguay | 97.2 /100 | #81 | Exceptional 2.7% |
| Immigrants | Armenia | 97.2 /100 | #82 | Exceptional 2.7% |
| Immigrants | Cuba | 97.2 /100 | #83 | Exceptional 2.7% |
| Immigrants | Argentina | 97.0 /100 | #84 | Exceptional 2.8% |
| Immigrants | Northern Africa | 96.9 /100 | #85 | Exceptional 2.8% |
| Immigrants | Iran | 96.8 /100 | #86 | Exceptional 2.8% |
| Somalis | 96.7 /100 | #87 | Exceptional 2.8% |
| Immigrants | Turkey | 96.7 /100 | #88 | Exceptional 2.8% |
| Belizeans | 96.6 /100 | #89 | Exceptional 2.8% |
Demographics Similar to Choctaw by Hearing Disability
In terms of hearing disability, the demographic groups most similar to Choctaw are Alaska Native (4.5%, a difference of 1.4%), Pueblo (4.6%, a difference of 1.5%), Chickasaw (4.5%, a difference of 1.6%), Navajo (4.6%, a difference of 1.8%), and Tsimshian (4.7%, a difference of 3.4%).
| Demographics | Rating | Rank | Hearing Disability |
| Houma | 0.0 /100 | #332 | Tragic 4.2% |
| Dutch West Indians | 0.0 /100 | #333 | Tragic 4.3% |
| Aleuts | 0.0 /100 | #334 | Tragic 4.3% |
| Kiowa | 0.0 /100 | #335 | Tragic 4.3% |
| Creek | 0.0 /100 | #336 | Tragic 4.4% |
| Chickasaw | 0.0 /100 | #337 | Tragic 4.5% |
| Alaska Natives | 0.0 /100 | #338 | Tragic 4.5% |
| Choctaw | 0.0 /100 | #339 | Tragic 4.5% |
| Pueblo | 0.0 /100 | #340 | Tragic 4.6% |
| Navajo | 0.0 /100 | #341 | Tragic 4.6% |
| Tsimshian | 0.0 /100 | #342 | Tragic 4.7% |
| Inupiat | 0.0 /100 | #343 | Tragic 4.7% |
| Tlingit-Haida | 0.0 /100 | #344 | Tragic 4.8% |
| Alaskan Athabascans | 0.0 /100 | #345 | Tragic 5.3% |
| Colville | 0.0 /100 | #346 | Tragic 5.3% |