Immigrants from Australia vs Choctaw Hearing Disability
COMPARE
Immigrants from Australia
Choctaw
Hearing Disability
Hearing Disability Comparison
Immigrants from Australia
Choctaw
2.9%
HEARING DISABILITY
67.4/ 100
METRIC RATING
159th/ 347
METRIC RANK
4.5%
HEARING DISABILITY
0.0/ 100
METRIC RATING
339th/ 347
METRIC RANK
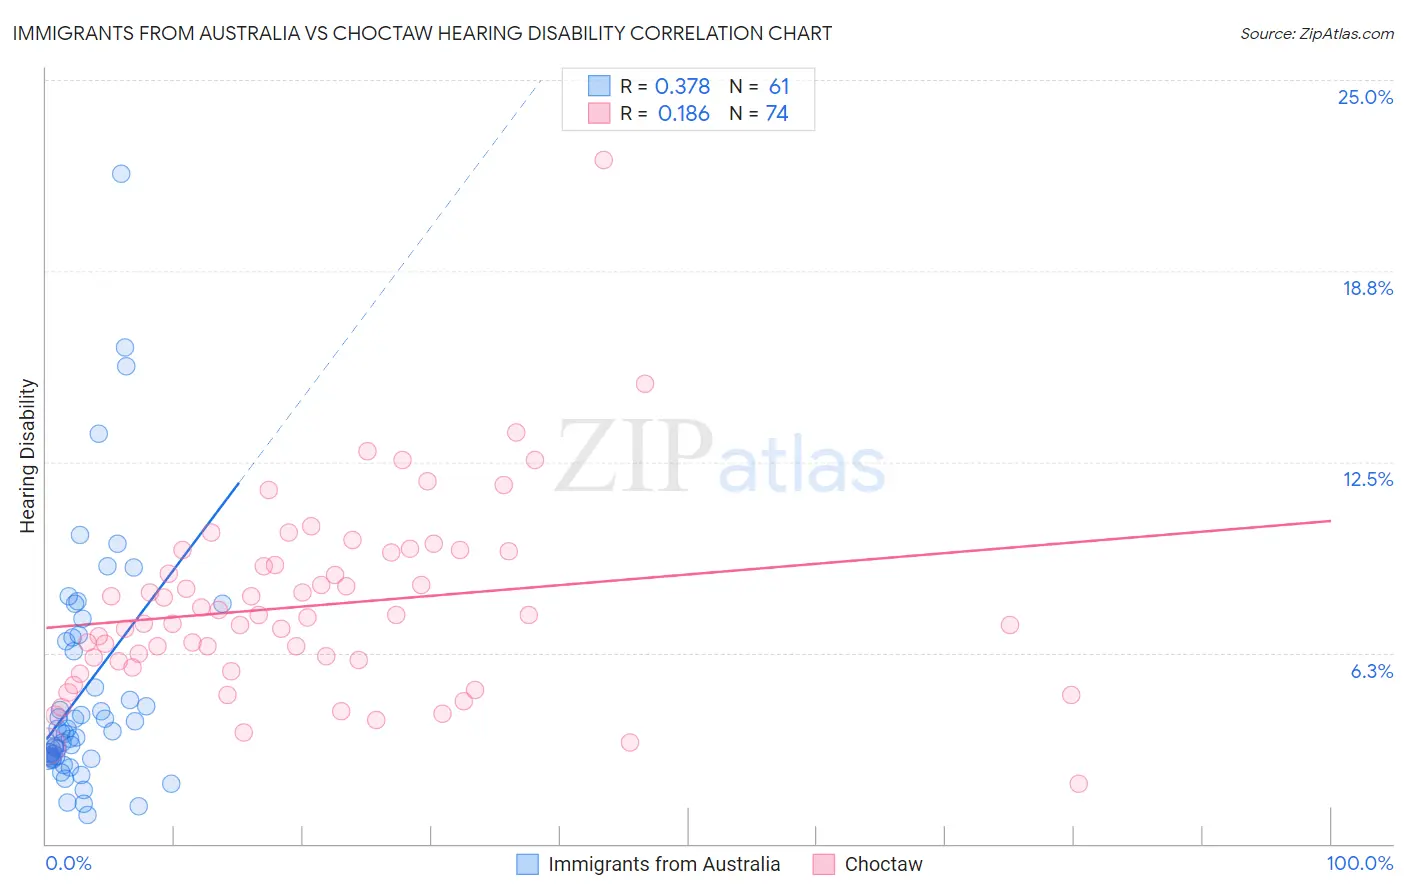
Immigrants from Australia vs Choctaw Hearing Disability Correlation Chart
The statistical analysis conducted on geographies consisting of 227,168,365 people shows a mild positive correlation between the proportion of Immigrants from Australia and percentage of population with hearing disability in the United States with a correlation coefficient (R) of 0.378 and weighted average of 2.9%. Similarly, the statistical analysis conducted on geographies consisting of 269,646,224 people shows a poor positive correlation between the proportion of Choctaw and percentage of population with hearing disability in the United States with a correlation coefficient (R) of 0.186 and weighted average of 4.5%, a difference of 54.5%.
Hearing Disability Correlation Summary
| Measurement | Immigrants from Australia | Choctaw |
| Minimum | 0.93% | 1.9% |
| Maximum | 21.9% | 22.4% |
| Range | 21.0% | 20.4% |
| Mean | 5.0% | 7.8% |
| Median | 3.6% | 7.4% |
| Interquartile 25% (IQ1) | 2.8% | 6.0% |
| Interquartile 75% (IQ3) | 6.7% | 9.5% |
| Interquartile Range (IQR) | 3.9% | 3.6% |
| Standard Deviation (Sample) | 3.9% | 3.1% |
| Standard Deviation (Population) | 3.9% | 3.1% |
Similar Demographics by Hearing Disability
Demographics Similar to Immigrants from Australia by Hearing Disability
In terms of hearing disability, the demographic groups most similar to Immigrants from Australia are Immigrants from Fiji (2.9%, a difference of 0.020%), Albanian (2.9%, a difference of 0.090%), Immigrants from Japan (2.9%, a difference of 0.11%), Immigrants from Burma/Myanmar (2.9%, a difference of 0.23%), and Immigrants from Kazakhstan (2.9%, a difference of 0.25%).
| Demographics | Rating | Rank | Hearing Disability |
| Immigrants | Lithuania | 73.0 /100 | #152 | Good 2.9% |
| Sudanese | 72.1 /100 | #153 | Good 2.9% |
| Immigrants | Lebanon | 71.5 /100 | #154 | Good 2.9% |
| Costa Ricans | 71.4 /100 | #155 | Good 2.9% |
| Immigrants | Poland | 70.2 /100 | #156 | Good 2.9% |
| Immigrants | Kazakhstan | 69.6 /100 | #157 | Good 2.9% |
| Immigrants | Burma/Myanmar | 69.5 /100 | #158 | Good 2.9% |
| Immigrants | Australia | 67.4 /100 | #159 | Good 2.9% |
| Immigrants | Fiji | 67.1 /100 | #160 | Good 2.9% |
| Albanians | 66.6 /100 | #161 | Good 2.9% |
| Immigrants | Japan | 66.3 /100 | #162 | Good 2.9% |
| Immigrants | Central America | 64.9 /100 | #163 | Good 3.0% |
| Immigrants | Cambodia | 64.8 /100 | #164 | Good 3.0% |
| Immigrants | Zimbabwe | 64.2 /100 | #165 | Good 3.0% |
| Immigrants | South Eastern Asia | 62.9 /100 | #166 | Good 3.0% |
Demographics Similar to Choctaw by Hearing Disability
In terms of hearing disability, the demographic groups most similar to Choctaw are Alaska Native (4.5%, a difference of 1.4%), Pueblo (4.6%, a difference of 1.5%), Chickasaw (4.5%, a difference of 1.6%), Navajo (4.6%, a difference of 1.8%), and Tsimshian (4.7%, a difference of 3.4%).
| Demographics | Rating | Rank | Hearing Disability |
| Houma | 0.0 /100 | #332 | Tragic 4.2% |
| Dutch West Indians | 0.0 /100 | #333 | Tragic 4.3% |
| Aleuts | 0.0 /100 | #334 | Tragic 4.3% |
| Kiowa | 0.0 /100 | #335 | Tragic 4.3% |
| Creek | 0.0 /100 | #336 | Tragic 4.4% |
| Chickasaw | 0.0 /100 | #337 | Tragic 4.5% |
| Alaska Natives | 0.0 /100 | #338 | Tragic 4.5% |
| Choctaw | 0.0 /100 | #339 | Tragic 4.5% |
| Pueblo | 0.0 /100 | #340 | Tragic 4.6% |
| Navajo | 0.0 /100 | #341 | Tragic 4.6% |
| Tsimshian | 0.0 /100 | #342 | Tragic 4.7% |
| Inupiat | 0.0 /100 | #343 | Tragic 4.7% |
| Tlingit-Haida | 0.0 /100 | #344 | Tragic 4.8% |
| Alaskan Athabascans | 0.0 /100 | #345 | Tragic 5.3% |
| Colville | 0.0 /100 | #346 | Tragic 5.3% |