Immigrants from El Salvador vs Choctaw Hearing Disability
COMPARE
Immigrants from El Salvador
Choctaw
Hearing Disability
Hearing Disability Comparison
Immigrants from El Salvador
Choctaw
2.6%
HEARING DISABILITY
99.7/ 100
METRIC RATING
25th/ 347
METRIC RANK
4.5%
HEARING DISABILITY
0.0/ 100
METRIC RATING
339th/ 347
METRIC RANK
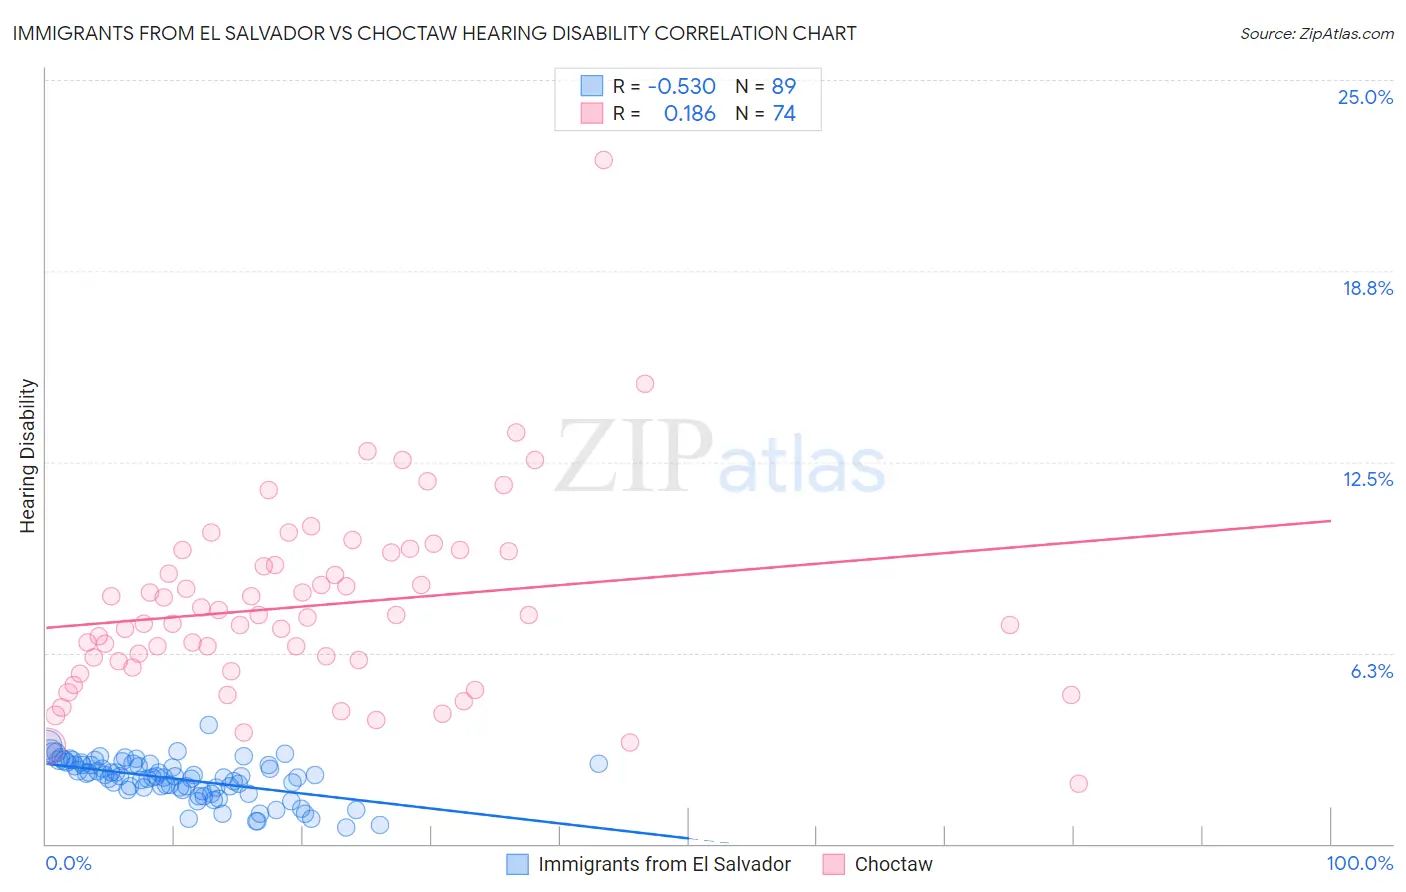
Immigrants from El Salvador vs Choctaw Hearing Disability Correlation Chart
The statistical analysis conducted on geographies consisting of 357,678,057 people shows a substantial negative correlation between the proportion of Immigrants from El Salvador and percentage of population with hearing disability in the United States with a correlation coefficient (R) of -0.530 and weighted average of 2.6%. Similarly, the statistical analysis conducted on geographies consisting of 269,646,224 people shows a poor positive correlation between the proportion of Choctaw and percentage of population with hearing disability in the United States with a correlation coefficient (R) of 0.186 and weighted average of 4.5%, a difference of 76.3%.
Hearing Disability Correlation Summary
| Measurement | Immigrants from El Salvador | Choctaw |
| Minimum | 0.55% | 1.9% |
| Maximum | 3.9% | 22.4% |
| Range | 3.3% | 20.4% |
| Mean | 2.1% | 7.8% |
| Median | 2.2% | 7.4% |
| Interquartile 25% (IQ1) | 1.8% | 6.0% |
| Interquartile 75% (IQ3) | 2.6% | 9.5% |
| Interquartile Range (IQR) | 0.86% | 3.6% |
| Standard Deviation (Sample) | 0.67% | 3.1% |
| Standard Deviation (Population) | 0.66% | 3.1% |
Similar Demographics by Hearing Disability
Demographics Similar to Immigrants from El Salvador by Hearing Disability
In terms of hearing disability, the demographic groups most similar to Immigrants from El Salvador are Immigrants from Senegal (2.6%, a difference of 0.010%), Immigrants from South Central Asia (2.6%, a difference of 0.050%), Immigrants from Ghana (2.6%, a difference of 0.40%), Immigrants from Haiti (2.6%, a difference of 0.42%), and Bolivian (2.6%, a difference of 0.45%).
| Demographics | Rating | Rank | Hearing Disability |
| Dominicans | 99.8 /100 | #18 | Exceptional 2.5% |
| Thais | 99.8 /100 | #19 | Exceptional 2.5% |
| Immigrants | Bolivia | 99.8 /100 | #20 | Exceptional 2.5% |
| Ghanaians | 99.8 /100 | #21 | Exceptional 2.5% |
| Immigrants | Sierra Leone | 99.8 /100 | #22 | Exceptional 2.6% |
| Immigrants | Nigeria | 99.8 /100 | #23 | Exceptional 2.6% |
| Immigrants | Ghana | 99.8 /100 | #24 | Exceptional 2.6% |
| Immigrants | El Salvador | 99.7 /100 | #25 | Exceptional 2.6% |
| Immigrants | Senegal | 99.7 /100 | #26 | Exceptional 2.6% |
| Immigrants | South Central Asia | 99.7 /100 | #27 | Exceptional 2.6% |
| Immigrants | Haiti | 99.7 /100 | #28 | Exceptional 2.6% |
| Bolivians | 99.7 /100 | #29 | Exceptional 2.6% |
| Immigrants | Caribbean | 99.7 /100 | #30 | Exceptional 2.6% |
| Immigrants | Cameroon | 99.7 /100 | #31 | Exceptional 2.6% |
| Immigrants | Venezuela | 99.7 /100 | #32 | Exceptional 2.6% |
Demographics Similar to Choctaw by Hearing Disability
In terms of hearing disability, the demographic groups most similar to Choctaw are Alaska Native (4.5%, a difference of 1.4%), Pueblo (4.6%, a difference of 1.5%), Chickasaw (4.5%, a difference of 1.6%), Navajo (4.6%, a difference of 1.8%), and Tsimshian (4.7%, a difference of 3.4%).
| Demographics | Rating | Rank | Hearing Disability |
| Houma | 0.0 /100 | #332 | Tragic 4.2% |
| Dutch West Indians | 0.0 /100 | #333 | Tragic 4.3% |
| Aleuts | 0.0 /100 | #334 | Tragic 4.3% |
| Kiowa | 0.0 /100 | #335 | Tragic 4.3% |
| Creek | 0.0 /100 | #336 | Tragic 4.4% |
| Chickasaw | 0.0 /100 | #337 | Tragic 4.5% |
| Alaska Natives | 0.0 /100 | #338 | Tragic 4.5% |
| Choctaw | 0.0 /100 | #339 | Tragic 4.5% |
| Pueblo | 0.0 /100 | #340 | Tragic 4.6% |
| Navajo | 0.0 /100 | #341 | Tragic 4.6% |
| Tsimshian | 0.0 /100 | #342 | Tragic 4.7% |
| Inupiat | 0.0 /100 | #343 | Tragic 4.7% |
| Tlingit-Haida | 0.0 /100 | #344 | Tragic 4.8% |
| Alaskan Athabascans | 0.0 /100 | #345 | Tragic 5.3% |
| Colville | 0.0 /100 | #346 | Tragic 5.3% |