Samoan vs Assyrian/Chaldean/Syriac Unemployment
COMPARE
Samoan
Assyrian/Chaldean/Syriac
Unemployment
Unemployment Comparison
Samoans
Assyrians/Chaldeans/Syriacs
5.5%
UNEMPLOYMENT
7.1/ 100
METRIC RATING
226th/ 347
METRIC RANK
5.3%
UNEMPLOYMENT
39.2/ 100
METRIC RATING
184th/ 347
METRIC RANK
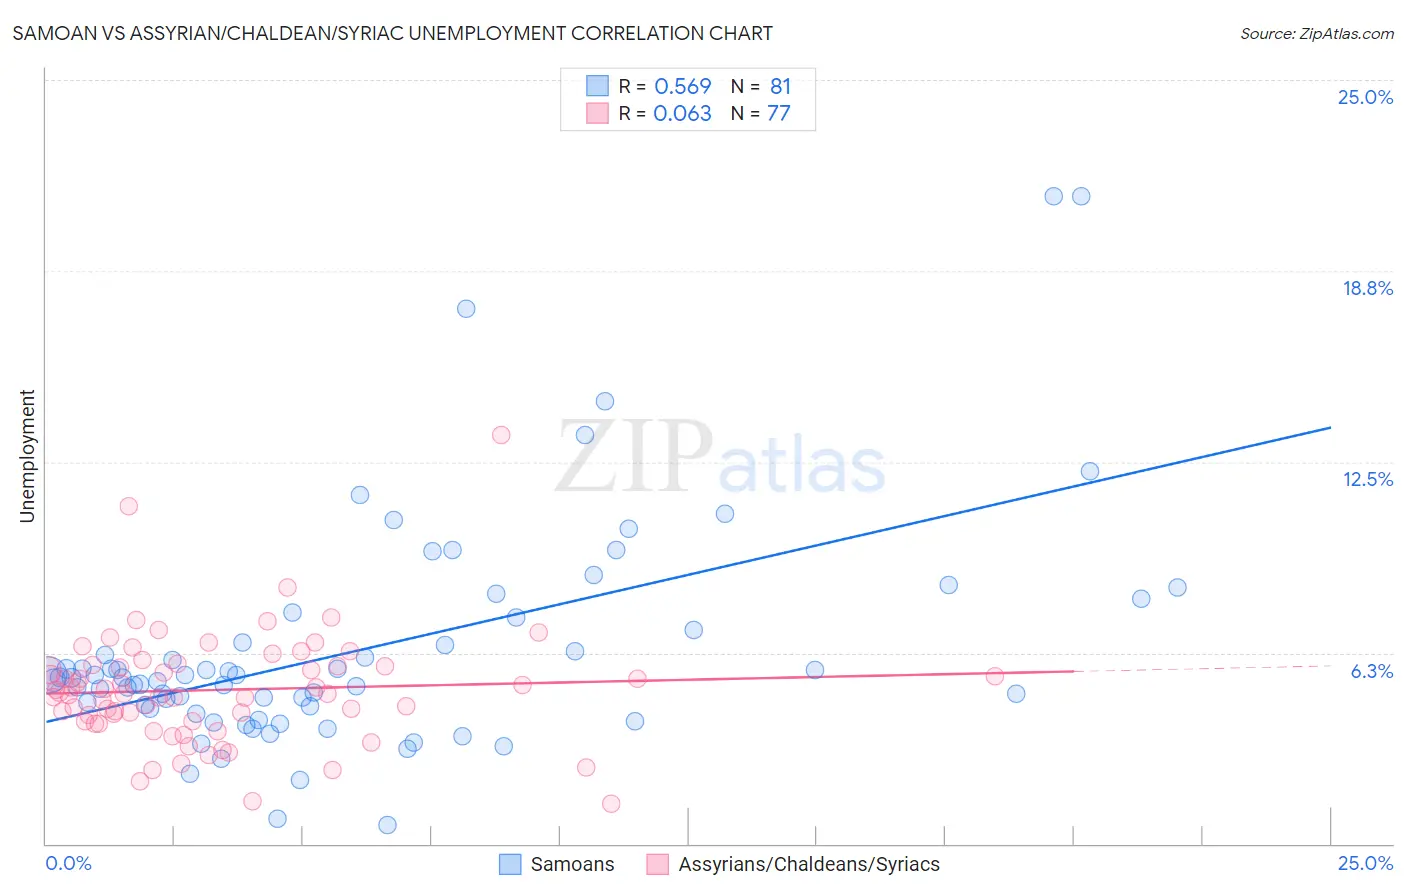
Samoan vs Assyrian/Chaldean/Syriac Unemployment Correlation Chart
The statistical analysis conducted on geographies consisting of 225,021,863 people shows a substantial positive correlation between the proportion of Samoans and unemployment in the United States with a correlation coefficient (R) of 0.569 and weighted average of 5.5%. Similarly, the statistical analysis conducted on geographies consisting of 110,292,838 people shows a slight positive correlation between the proportion of Assyrians/Chaldeans/Syriacs and unemployment in the United States with a correlation coefficient (R) of 0.063 and weighted average of 5.3%, a difference of 3.3%.
Unemployment Correlation Summary
| Measurement | Samoan | Assyrian/Chaldean/Syriac |
| Minimum | 0.60% | 1.3% |
| Maximum | 21.2% | 13.4% |
| Range | 20.6% | 12.1% |
| Mean | 6.4% | 5.0% |
| Median | 5.4% | 4.9% |
| Interquartile 25% (IQ1) | 4.5% | 4.0% |
| Interquartile 75% (IQ3) | 7.2% | 5.8% |
| Interquartile Range (IQR) | 2.7% | 1.8% |
| Standard Deviation (Sample) | 3.7% | 1.9% |
| Standard Deviation (Population) | 3.7% | 1.8% |
Similar Demographics by Unemployment
Demographics Similar to Samoans by Unemployment
In terms of unemployment, the demographic groups most similar to Samoans are Immigrants from Lebanon (5.5%, a difference of 0.030%), South American Indian (5.5%, a difference of 0.15%), Guamanian/Chamorro (5.5%, a difference of 0.18%), Israeli (5.4%, a difference of 0.35%), and Seminole (5.4%, a difference of 0.42%).
| Demographics | Rating | Rank | Unemployment |
| Bangladeshis | 11.2 /100 | #219 | Poor 5.4% |
| Soviet Union | 10.6 /100 | #220 | Poor 5.4% |
| Immigrants | Philippines | 10.4 /100 | #221 | Poor 5.4% |
| Iroquois | 10.3 /100 | #222 | Poor 5.4% |
| Seminole | 9.2 /100 | #223 | Tragic 5.4% |
| Israelis | 8.8 /100 | #224 | Tragic 5.4% |
| South American Indians | 7.8 /100 | #225 | Tragic 5.5% |
| Samoans | 7.1 /100 | #226 | Tragic 5.5% |
| Immigrants | Lebanon | 7.0 /100 | #227 | Tragic 5.5% |
| Guamanians/Chamorros | 6.3 /100 | #228 | Tragic 5.5% |
| Hawaiians | 5.4 /100 | #229 | Tragic 5.5% |
| Ottawa | 5.4 /100 | #230 | Tragic 5.5% |
| Immigrants | Africa | 4.9 /100 | #231 | Tragic 5.5% |
| Comanche | 4.9 /100 | #232 | Tragic 5.5% |
| Immigrants | Syria | 4.8 /100 | #233 | Tragic 5.5% |
Demographics Similar to Assyrians/Chaldeans/Syriacs by Unemployment
In terms of unemployment, the demographic groups most similar to Assyrians/Chaldeans/Syriacs are Immigrants from Thailand (5.3%, a difference of 0.020%), Brazilian (5.3%, a difference of 0.060%), Immigrants from Uganda (5.3%, a difference of 0.090%), Costa Rican (5.3%, a difference of 0.12%), and Alsatian (5.3%, a difference of 0.14%).
| Demographics | Rating | Rank | Unemployment |
| Immigrants | Nonimmigrants | 47.9 /100 | #177 | Average 5.3% |
| Afghans | 47.4 /100 | #178 | Average 5.3% |
| Malaysians | 46.8 /100 | #179 | Average 5.3% |
| Immigrants | Greece | 45.0 /100 | #180 | Average 5.3% |
| Albanians | 43.5 /100 | #181 | Average 5.3% |
| Spaniards | 42.2 /100 | #182 | Average 5.3% |
| Brazilians | 40.2 /100 | #183 | Average 5.3% |
| Assyrians/Chaldeans/Syriacs | 39.2 /100 | #184 | Fair 5.3% |
| Immigrants | Thailand | 38.9 /100 | #185 | Fair 5.3% |
| Immigrants | Uganda | 37.8 /100 | #186 | Fair 5.3% |
| Costa Ricans | 37.4 /100 | #187 | Fair 5.3% |
| Alsatians | 37.0 /100 | #188 | Fair 5.3% |
| Immigrants | Belarus | 35.6 /100 | #189 | Fair 5.3% |
| Arabs | 35.3 /100 | #190 | Fair 5.3% |
| Somalis | 34.0 /100 | #191 | Fair 5.3% |