Russian vs Immigrants from Kazakhstan Vision Disability
COMPARE
Russian
Immigrants from Kazakhstan
Vision Disability
Vision Disability Comparison
Russians
Immigrants from Kazakhstan
2.0%
VISION DISABILITY
98.6/ 100
METRIC RATING
69th/ 347
METRIC RANK
2.0%
VISION DISABILITY
98.6/ 100
METRIC RATING
70th/ 347
METRIC RANK
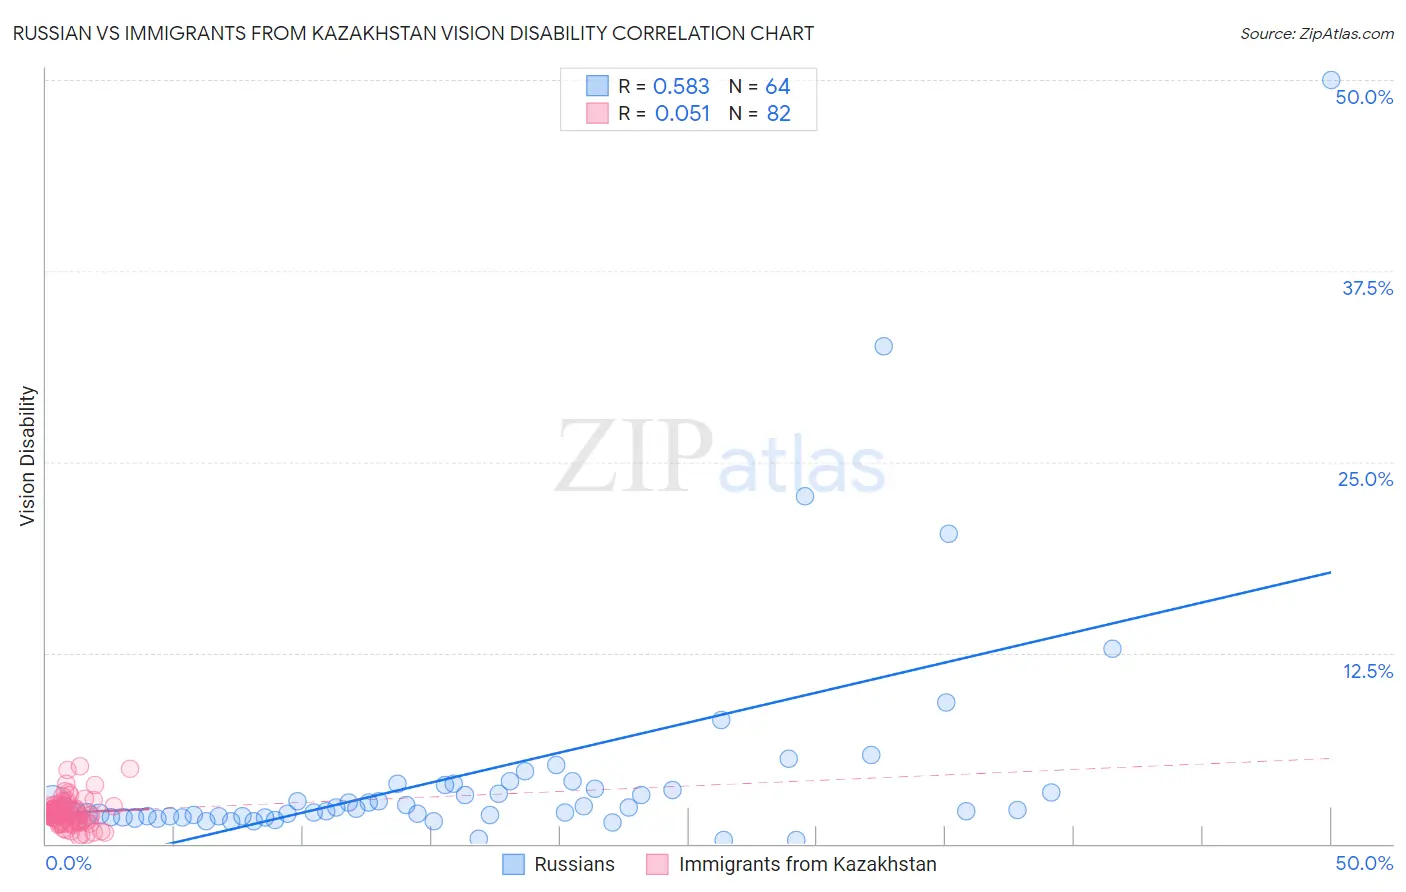
Russian vs Immigrants from Kazakhstan Vision Disability Correlation Chart
The statistical analysis conducted on geographies consisting of 511,148,193 people shows a substantial positive correlation between the proportion of Russians and percentage of population with vision disability in the United States with a correlation coefficient (R) of 0.583 and weighted average of 2.0%. Similarly, the statistical analysis conducted on geographies consisting of 124,421,317 people shows a slight positive correlation between the proportion of Immigrants from Kazakhstan and percentage of population with vision disability in the United States with a correlation coefficient (R) of 0.051 and weighted average of 2.0%, a difference of 0.020%.
Vision Disability Correlation Summary
| Measurement | Russian | Immigrants from Kazakhstan |
| Minimum | 0.22% | 0.47% |
| Maximum | 50.0% | 5.1% |
| Range | 49.8% | 4.6% |
| Mean | 4.6% | 2.0% |
| Median | 2.2% | 1.9% |
| Interquartile 25% (IQ1) | 1.8% | 1.5% |
| Interquartile 75% (IQ3) | 3.7% | 2.3% |
| Interquartile Range (IQR) | 1.9% | 0.85% |
| Standard Deviation (Sample) | 7.8% | 0.91% |
| Standard Deviation (Population) | 7.8% | 0.90% |
Demographics Similar to Russians and Immigrants from Kazakhstan by Vision Disability
In terms of vision disability, the demographic groups most similar to Russians are Immigrants from Northern Europe (2.0%, a difference of 0.030%), Immigrants from France (2.0%, a difference of 0.080%), Immigrants from Czechoslovakia (2.0%, a difference of 0.17%), Immigrants from Northern Africa (2.0%, a difference of 0.27%), and Immigrants from Eritrea (2.0%, a difference of 0.28%). Similarly, the demographic groups most similar to Immigrants from Kazakhstan are Immigrants from Northern Europe (2.0%, a difference of 0.010%), Immigrants from France (2.0%, a difference of 0.060%), Immigrants from Czechoslovakia (2.0%, a difference of 0.19%), Immigrants from Eritrea (2.0%, a difference of 0.26%), and Immigrants from Northern Africa (2.0%, a difference of 0.29%).
| Demographics | Rating | Rank | Vision Disability |
| Argentineans | 99.1 /100 | #59 | Exceptional 2.0% |
| Immigrants | Romania | 99.1 /100 | #60 | Exceptional 2.0% |
| Immigrants | Belgium | 99.1 /100 | #61 | Exceptional 2.0% |
| Immigrants | Russia | 99.1 /100 | #62 | Exceptional 2.0% |
| Armenians | 99.0 /100 | #63 | Exceptional 2.0% |
| Immigrants | Greece | 99.0 /100 | #64 | Exceptional 2.0% |
| Maltese | 98.9 /100 | #65 | Exceptional 2.0% |
| Immigrants | Argentina | 98.9 /100 | #66 | Exceptional 2.0% |
| Immigrants | Northern Africa | 98.8 /100 | #67 | Exceptional 2.0% |
| Immigrants | Czechoslovakia | 98.7 /100 | #68 | Exceptional 2.0% |
| Russians | 98.6 /100 | #69 | Exceptional 2.0% |
| Immigrants | Kazakhstan | 98.6 /100 | #70 | Exceptional 2.0% |
| Immigrants | Northern Europe | 98.6 /100 | #71 | Exceptional 2.0% |
| Immigrants | France | 98.5 /100 | #72 | Exceptional 2.0% |
| Immigrants | Eritrea | 98.4 /100 | #73 | Exceptional 2.0% |
| Palestinians | 98.3 /100 | #74 | Exceptional 2.0% |
| Immigrants | North Macedonia | 98.3 /100 | #75 | Exceptional 2.0% |
| Paraguayans | 98.3 /100 | #76 | Exceptional 2.0% |
| Immigrants | Jordan | 98.3 /100 | #77 | Exceptional 2.0% |
| Immigrants | Eastern Europe | 98.3 /100 | #78 | Exceptional 2.0% |
| Assyrians/Chaldeans/Syriacs | 98.1 /100 | #79 | Exceptional 2.0% |