Russian vs Immigrants from Guatemala Vision Disability
COMPARE
Russian
Immigrants from Guatemala
Vision Disability
Vision Disability Comparison
Russians
Immigrants from Guatemala
2.0%
VISION DISABILITY
98.6/ 100
METRIC RATING
69th/ 347
METRIC RANK
2.4%
VISION DISABILITY
0.3/ 100
METRIC RATING
255th/ 347
METRIC RANK
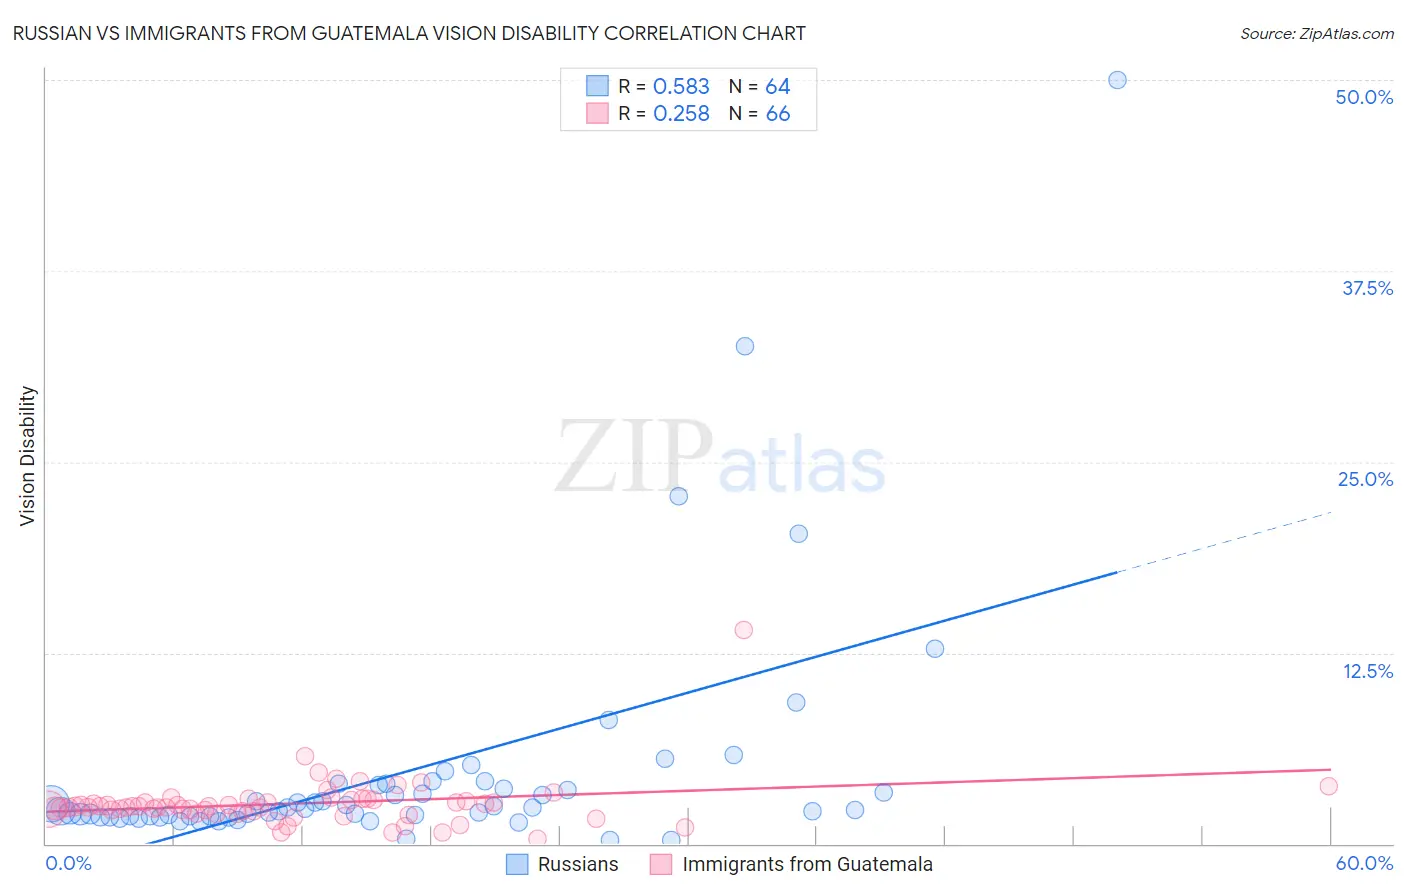
Russian vs Immigrants from Guatemala Vision Disability Correlation Chart
The statistical analysis conducted on geographies consisting of 511,148,193 people shows a substantial positive correlation between the proportion of Russians and percentage of population with vision disability in the United States with a correlation coefficient (R) of 0.583 and weighted average of 2.0%. Similarly, the statistical analysis conducted on geographies consisting of 377,092,792 people shows a weak positive correlation between the proportion of Immigrants from Guatemala and percentage of population with vision disability in the United States with a correlation coefficient (R) of 0.258 and weighted average of 2.4%, a difference of 17.2%.
Vision Disability Correlation Summary
| Measurement | Russian | Immigrants from Guatemala |
| Minimum | 0.22% | 0.29% |
| Maximum | 50.0% | 14.0% |
| Range | 49.8% | 13.7% |
| Mean | 4.6% | 2.6% |
| Median | 2.2% | 2.4% |
| Interquartile 25% (IQ1) | 1.8% | 2.1% |
| Interquartile 75% (IQ3) | 3.7% | 2.9% |
| Interquartile Range (IQR) | 1.9% | 0.78% |
| Standard Deviation (Sample) | 7.8% | 1.7% |
| Standard Deviation (Population) | 7.8% | 1.7% |
Similar Demographics by Vision Disability
Demographics Similar to Russians by Vision Disability
In terms of vision disability, the demographic groups most similar to Russians are Immigrants from Kazakhstan (2.0%, a difference of 0.020%), Immigrants from Northern Europe (2.0%, a difference of 0.030%), Immigrants from France (2.0%, a difference of 0.080%), Immigrants from Czechoslovakia (2.0%, a difference of 0.17%), and Immigrants from Northern Africa (2.0%, a difference of 0.27%).
| Demographics | Rating | Rank | Vision Disability |
| Immigrants | Russia | 99.1 /100 | #62 | Exceptional 2.0% |
| Armenians | 99.0 /100 | #63 | Exceptional 2.0% |
| Immigrants | Greece | 99.0 /100 | #64 | Exceptional 2.0% |
| Maltese | 98.9 /100 | #65 | Exceptional 2.0% |
| Immigrants | Argentina | 98.9 /100 | #66 | Exceptional 2.0% |
| Immigrants | Northern Africa | 98.8 /100 | #67 | Exceptional 2.0% |
| Immigrants | Czechoslovakia | 98.7 /100 | #68 | Exceptional 2.0% |
| Russians | 98.6 /100 | #69 | Exceptional 2.0% |
| Immigrants | Kazakhstan | 98.6 /100 | #70 | Exceptional 2.0% |
| Immigrants | Northern Europe | 98.6 /100 | #71 | Exceptional 2.0% |
| Immigrants | France | 98.5 /100 | #72 | Exceptional 2.0% |
| Immigrants | Eritrea | 98.4 /100 | #73 | Exceptional 2.0% |
| Palestinians | 98.3 /100 | #74 | Exceptional 2.0% |
| Immigrants | North Macedonia | 98.3 /100 | #75 | Exceptional 2.0% |
| Paraguayans | 98.3 /100 | #76 | Exceptional 2.0% |
Demographics Similar to Immigrants from Guatemala by Vision Disability
In terms of vision disability, the demographic groups most similar to Immigrants from Guatemala are Haitian (2.4%, a difference of 0.030%), Japanese (2.4%, a difference of 0.31%), Immigrants from Haiti (2.4%, a difference of 0.33%), Immigrants from Micronesia (2.4%, a difference of 0.38%), and West Indian (2.4%, a difference of 0.40%).
| Demographics | Rating | Rank | Vision Disability |
| Sub-Saharan Africans | 0.5 /100 | #248 | Tragic 2.3% |
| Liberians | 0.5 /100 | #249 | Tragic 2.3% |
| Bangladeshis | 0.5 /100 | #250 | Tragic 2.3% |
| Immigrants | Laos | 0.4 /100 | #251 | Tragic 2.4% |
| Immigrants | Micronesia | 0.3 /100 | #252 | Tragic 2.4% |
| Japanese | 0.3 /100 | #253 | Tragic 2.4% |
| Haitians | 0.3 /100 | #254 | Tragic 2.4% |
| Immigrants | Guatemala | 0.3 /100 | #255 | Tragic 2.4% |
| Immigrants | Haiti | 0.2 /100 | #256 | Tragic 2.4% |
| West Indians | 0.2 /100 | #257 | Tragic 2.4% |
| British West Indians | 0.2 /100 | #258 | Tragic 2.4% |
| Whites/Caucasians | 0.2 /100 | #259 | Tragic 2.4% |
| Belizeans | 0.2 /100 | #260 | Tragic 2.4% |
| Fijians | 0.1 /100 | #261 | Tragic 2.4% |
| Jamaicans | 0.1 /100 | #262 | Tragic 2.4% |