Israeli vs Immigrants from Lithuania Vision Disability
COMPARE
Israeli
Immigrants from Lithuania
Vision Disability
Vision Disability Comparison
Israelis
Immigrants from Lithuania
2.0%
VISION DISABILITY
99.6/ 100
METRIC RATING
48th/ 347
METRIC RANK
1.9%
VISION DISABILITY
99.9/ 100
METRIC RATING
24th/ 347
METRIC RANK
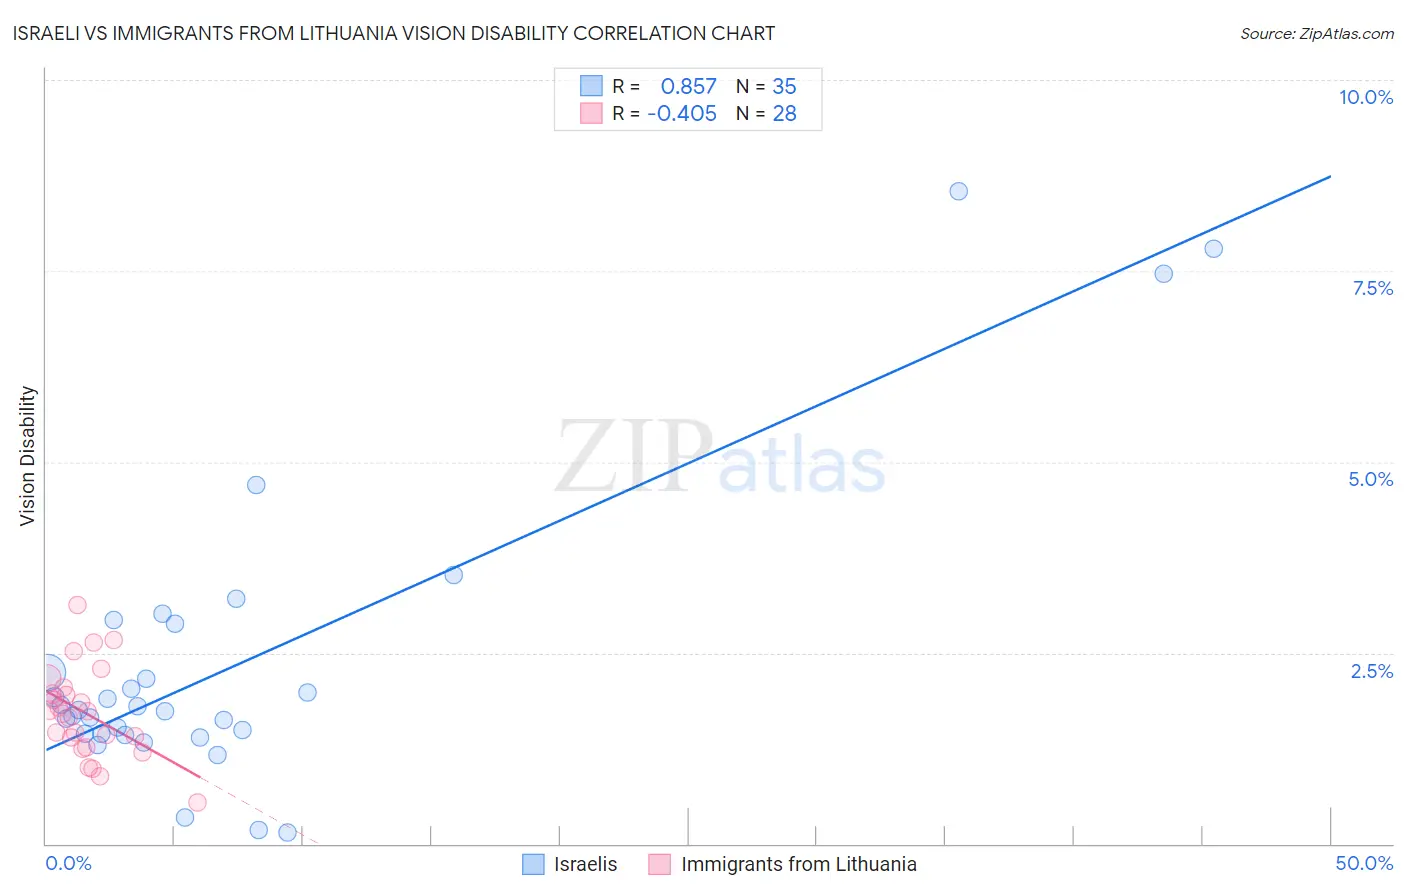
Israeli vs Immigrants from Lithuania Vision Disability Correlation Chart
The statistical analysis conducted on geographies consisting of 211,077,295 people shows a very strong positive correlation between the proportion of Israelis and percentage of population with vision disability in the United States with a correlation coefficient (R) of 0.857 and weighted average of 2.0%. Similarly, the statistical analysis conducted on geographies consisting of 117,709,578 people shows a moderate negative correlation between the proportion of Immigrants from Lithuania and percentage of population with vision disability in the United States with a correlation coefficient (R) of -0.405 and weighted average of 1.9%, a difference of 3.3%.
Vision Disability Correlation Summary
| Measurement | Israeli | Immigrants from Lithuania |
| Minimum | 0.15% | 0.53% |
| Maximum | 8.5% | 3.1% |
| Range | 8.4% | 2.6% |
| Mean | 2.4% | 1.7% |
| Median | 1.8% | 1.7% |
| Interquartile 25% (IQ1) | 1.4% | 1.3% |
| Interquartile 75% (IQ3) | 2.9% | 2.0% |
| Interquartile Range (IQR) | 1.4% | 0.69% |
| Standard Deviation (Sample) | 1.9% | 0.59% |
| Standard Deviation (Population) | 1.9% | 0.58% |
Similar Demographics by Vision Disability
Demographics Similar to Israelis by Vision Disability
In terms of vision disability, the demographic groups most similar to Israelis are Latvian (2.0%, a difference of 0.070%), Afghan (2.0%, a difference of 0.13%), Tongan (2.0%, a difference of 0.22%), Immigrants from Bulgaria (2.0%, a difference of 0.46%), and Immigrants from Sweden (2.0%, a difference of 0.48%).
| Demographics | Rating | Rank | Vision Disability |
| Cypriots | 99.7 /100 | #41 | Exceptional 2.0% |
| Immigrants | Ethiopia | 99.7 /100 | #42 | Exceptional 2.0% |
| Eastern Europeans | 99.7 /100 | #43 | Exceptional 2.0% |
| Immigrants | Indonesia | 99.7 /100 | #44 | Exceptional 2.0% |
| Ethiopians | 99.7 /100 | #45 | Exceptional 2.0% |
| Immigrants | Sweden | 99.7 /100 | #46 | Exceptional 2.0% |
| Immigrants | Bulgaria | 99.7 /100 | #47 | Exceptional 2.0% |
| Israelis | 99.6 /100 | #48 | Exceptional 2.0% |
| Latvians | 99.5 /100 | #49 | Exceptional 2.0% |
| Afghans | 99.5 /100 | #50 | Exceptional 2.0% |
| Tongans | 99.5 /100 | #51 | Exceptional 2.0% |
| Immigrants | Serbia | 99.4 /100 | #52 | Exceptional 2.0% |
| Immigrants | Belarus | 99.3 /100 | #53 | Exceptional 2.0% |
| Macedonians | 99.3 /100 | #54 | Exceptional 2.0% |
| Laotians | 99.3 /100 | #55 | Exceptional 2.0% |
Demographics Similar to Immigrants from Lithuania by Vision Disability
In terms of vision disability, the demographic groups most similar to Immigrants from Lithuania are Bulgarian (1.9%, a difference of 0.040%), Immigrants from Japan (1.9%, a difference of 0.080%), Immigrants from Asia (1.9%, a difference of 0.12%), Taiwanese (1.9%, a difference of 0.41%), and Immigrants from Malaysia (1.9%, a difference of 0.44%).
| Demographics | Rating | Rank | Vision Disability |
| Burmese | 100.0 /100 | #17 | Exceptional 1.8% |
| Bolivians | 100.0 /100 | #18 | Exceptional 1.9% |
| Immigrants | Sri Lanka | 100.0 /100 | #19 | Exceptional 1.9% |
| Asians | 100.0 /100 | #20 | Exceptional 1.9% |
| Turks | 100.0 /100 | #21 | Exceptional 1.9% |
| Immigrants | Pakistan | 100.0 /100 | #22 | Exceptional 1.9% |
| Immigrants | Asia | 99.9 /100 | #23 | Exceptional 1.9% |
| Immigrants | Lithuania | 99.9 /100 | #24 | Exceptional 1.9% |
| Bulgarians | 99.9 /100 | #25 | Exceptional 1.9% |
| Immigrants | Japan | 99.9 /100 | #26 | Exceptional 1.9% |
| Taiwanese | 99.9 /100 | #27 | Exceptional 1.9% |
| Immigrants | Malaysia | 99.9 /100 | #28 | Exceptional 1.9% |
| Egyptians | 99.9 /100 | #29 | Exceptional 1.9% |
| Immigrants | Nepal | 99.9 /100 | #30 | Exceptional 1.9% |
| Mongolians | 99.9 /100 | #31 | Exceptional 1.9% |