Russian vs Finnish Vision Disability
COMPARE
Russian
Finnish
Vision Disability
Vision Disability Comparison
Russians
Finns
2.0%
VISION DISABILITY
98.6/ 100
METRIC RATING
69th/ 347
METRIC RANK
2.1%
VISION DISABILITY
78.3/ 100
METRIC RATING
148th/ 347
METRIC RANK
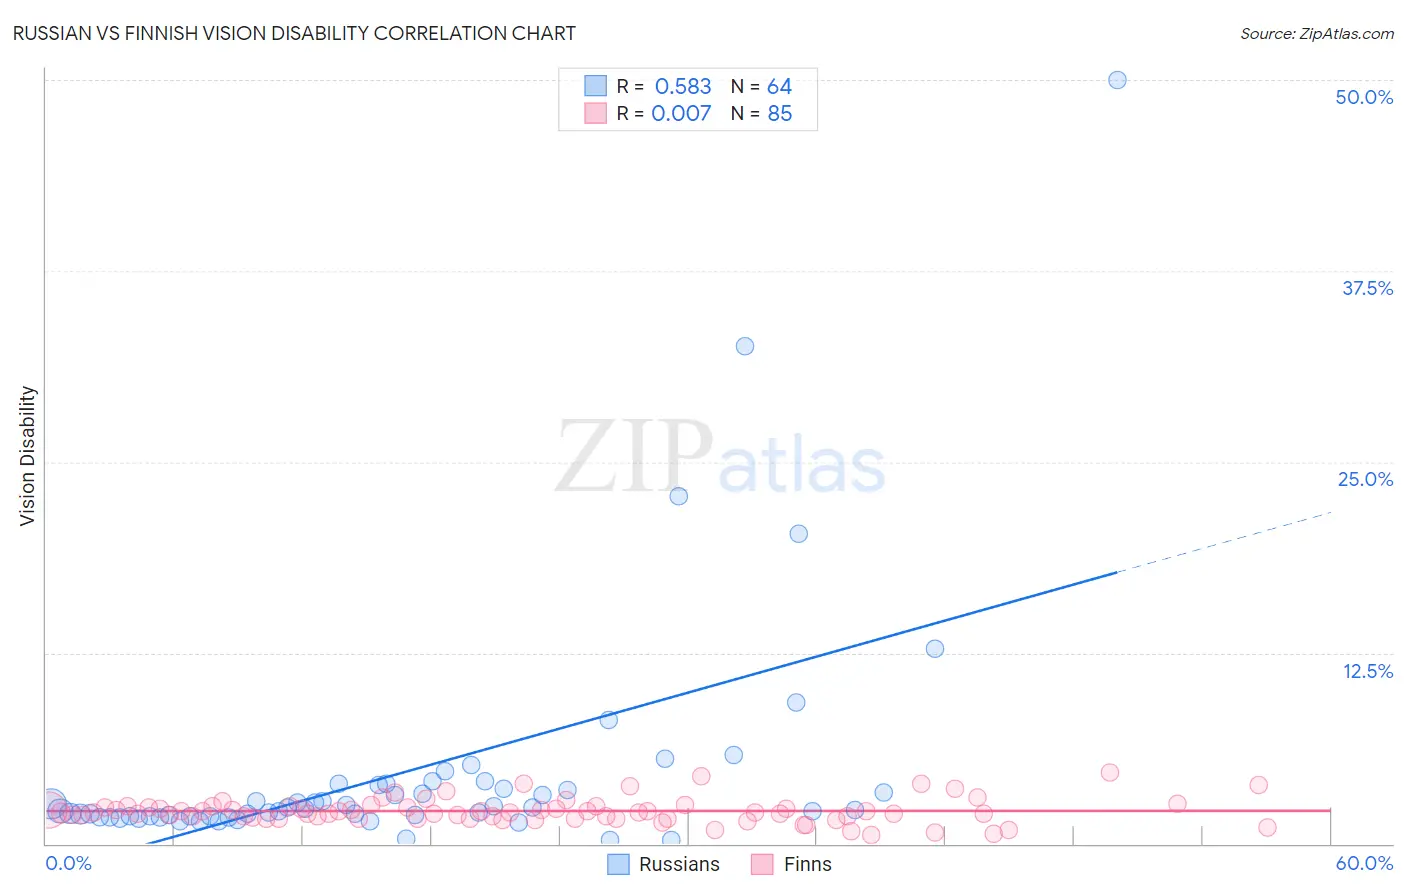
Russian vs Finnish Vision Disability Correlation Chart
The statistical analysis conducted on geographies consisting of 511,148,193 people shows a substantial positive correlation between the proportion of Russians and percentage of population with vision disability in the United States with a correlation coefficient (R) of 0.583 and weighted average of 2.0%. Similarly, the statistical analysis conducted on geographies consisting of 404,250,677 people shows no correlation between the proportion of Finns and percentage of population with vision disability in the United States with a correlation coefficient (R) of 0.007 and weighted average of 2.1%, a difference of 5.0%.
Vision Disability Correlation Summary
| Measurement | Russian | Finnish |
| Minimum | 0.22% | 0.59% |
| Maximum | 50.0% | 4.6% |
| Range | 49.8% | 4.0% |
| Mean | 4.6% | 2.1% |
| Median | 2.2% | 2.1% |
| Interquartile 25% (IQ1) | 1.8% | 1.7% |
| Interquartile 75% (IQ3) | 3.7% | 2.4% |
| Interquartile Range (IQR) | 1.9% | 0.76% |
| Standard Deviation (Sample) | 7.8% | 0.79% |
| Standard Deviation (Population) | 7.8% | 0.79% |
Similar Demographics by Vision Disability
Demographics Similar to Russians by Vision Disability
In terms of vision disability, the demographic groups most similar to Russians are Immigrants from Kazakhstan (2.0%, a difference of 0.020%), Immigrants from Northern Europe (2.0%, a difference of 0.030%), Immigrants from France (2.0%, a difference of 0.080%), Immigrants from Czechoslovakia (2.0%, a difference of 0.17%), and Immigrants from Northern Africa (2.0%, a difference of 0.27%).
| Demographics | Rating | Rank | Vision Disability |
| Immigrants | Russia | 99.1 /100 | #62 | Exceptional 2.0% |
| Armenians | 99.0 /100 | #63 | Exceptional 2.0% |
| Immigrants | Greece | 99.0 /100 | #64 | Exceptional 2.0% |
| Maltese | 98.9 /100 | #65 | Exceptional 2.0% |
| Immigrants | Argentina | 98.9 /100 | #66 | Exceptional 2.0% |
| Immigrants | Northern Africa | 98.8 /100 | #67 | Exceptional 2.0% |
| Immigrants | Czechoslovakia | 98.7 /100 | #68 | Exceptional 2.0% |
| Russians | 98.6 /100 | #69 | Exceptional 2.0% |
| Immigrants | Kazakhstan | 98.6 /100 | #70 | Exceptional 2.0% |
| Immigrants | Northern Europe | 98.6 /100 | #71 | Exceptional 2.0% |
| Immigrants | France | 98.5 /100 | #72 | Exceptional 2.0% |
| Immigrants | Eritrea | 98.4 /100 | #73 | Exceptional 2.0% |
| Palestinians | 98.3 /100 | #74 | Exceptional 2.0% |
| Immigrants | North Macedonia | 98.3 /100 | #75 | Exceptional 2.0% |
| Paraguayans | 98.3 /100 | #76 | Exceptional 2.0% |
Demographics Similar to Finns by Vision Disability
In terms of vision disability, the demographic groups most similar to Finns are Immigrants from Sudan (2.1%, a difference of 0.010%), Italian (2.1%, a difference of 0.14%), Colombian (2.1%, a difference of 0.19%), Belgian (2.1%, a difference of 0.22%), and Immigrants from Norway (2.1%, a difference of 0.25%).
| Demographics | Rating | Rank | Vision Disability |
| Sierra Leoneans | 84.1 /100 | #141 | Excellent 2.1% |
| South Americans | 82.8 /100 | #142 | Excellent 2.1% |
| Immigrants | Sierra Leone | 82.8 /100 | #143 | Excellent 2.1% |
| Ukrainians | 81.9 /100 | #144 | Excellent 2.1% |
| Immigrants | Bosnia and Herzegovina | 81.5 /100 | #145 | Excellent 2.1% |
| Italians | 79.7 /100 | #146 | Good 2.1% |
| Immigrants | Sudan | 78.4 /100 | #147 | Good 2.1% |
| Finns | 78.3 /100 | #148 | Good 2.1% |
| Colombians | 76.2 /100 | #149 | Good 2.1% |
| Belgians | 75.9 /100 | #150 | Good 2.1% |
| Immigrants | Norway | 75.5 /100 | #151 | Good 2.1% |
| Immigrants | Southern Europe | 74.6 /100 | #152 | Good 2.1% |
| Immigrants | South America | 73.8 /100 | #153 | Good 2.1% |
| Slovenes | 73.6 /100 | #154 | Good 2.1% |
| Immigrants | Colombia | 72.1 /100 | #155 | Good 2.1% |