Spanish vs Immigrants from Lithuania Vision Disability
COMPARE
Spanish
Immigrants from Lithuania
Vision Disability
Vision Disability Comparison
Spanish
Immigrants from Lithuania
2.4%
VISION DISABILITY
0.0/ 100
METRIC RATING
278th/ 347
METRIC RANK
1.9%
VISION DISABILITY
99.9/ 100
METRIC RATING
24th/ 347
METRIC RANK
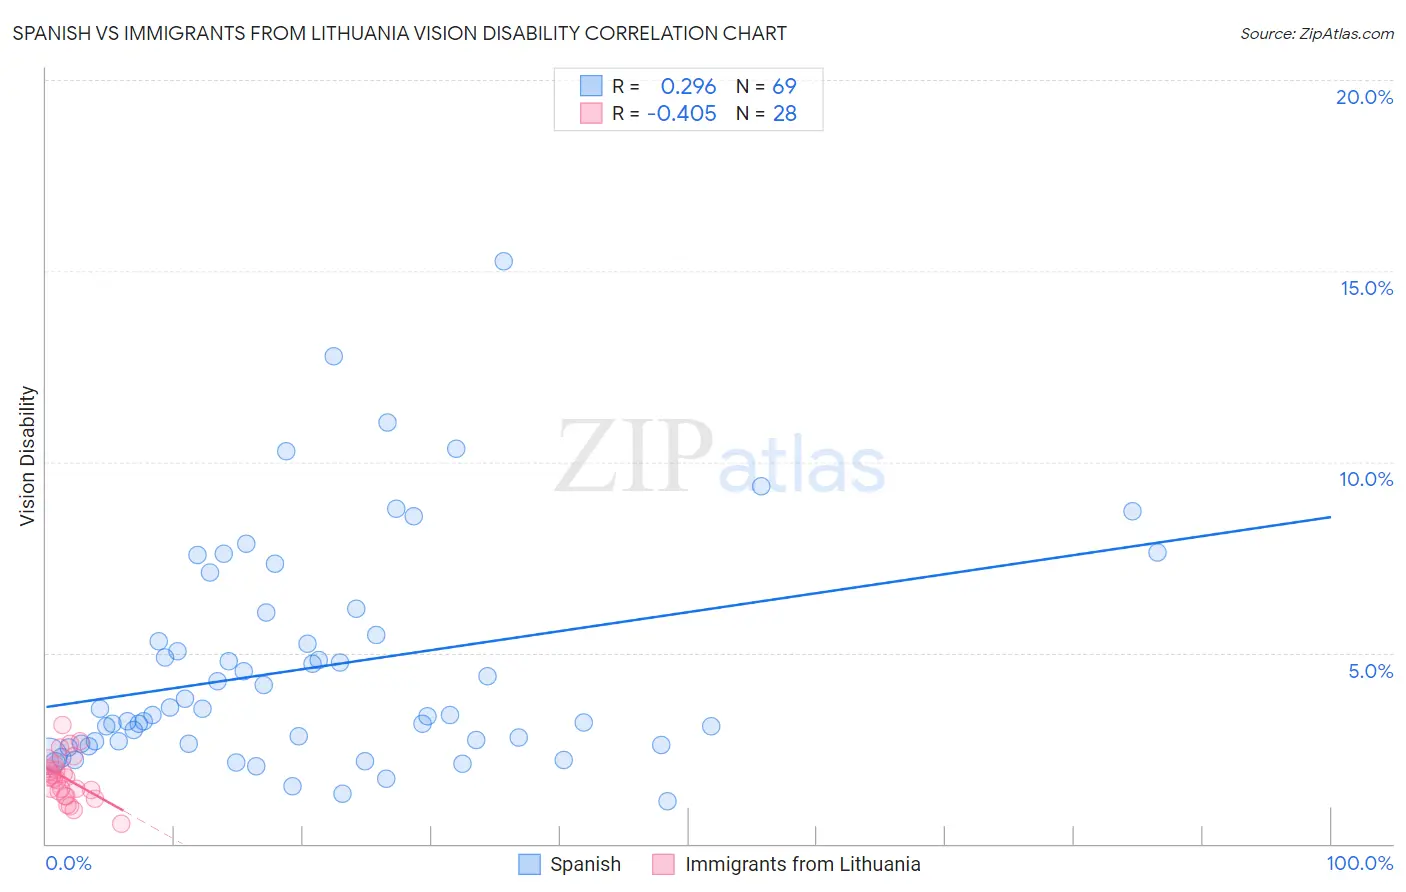
Spanish vs Immigrants from Lithuania Vision Disability Correlation Chart
The statistical analysis conducted on geographies consisting of 421,761,942 people shows a weak positive correlation between the proportion of Spanish and percentage of population with vision disability in the United States with a correlation coefficient (R) of 0.296 and weighted average of 2.4%. Similarly, the statistical analysis conducted on geographies consisting of 117,709,578 people shows a moderate negative correlation between the proportion of Immigrants from Lithuania and percentage of population with vision disability in the United States with a correlation coefficient (R) of -0.405 and weighted average of 1.9%, a difference of 27.4%.
Vision Disability Correlation Summary
| Measurement | Spanish | Immigrants from Lithuania |
| Minimum | 1.1% | 0.53% |
| Maximum | 15.3% | 3.1% |
| Range | 14.1% | 2.6% |
| Mean | 4.6% | 1.7% |
| Median | 3.4% | 1.7% |
| Interquartile 25% (IQ1) | 2.6% | 1.3% |
| Interquartile 75% (IQ3) | 5.8% | 2.0% |
| Interquartile Range (IQR) | 3.1% | 0.69% |
| Standard Deviation (Sample) | 2.9% | 0.59% |
| Standard Deviation (Population) | 2.9% | 0.58% |
Similar Demographics by Vision Disability
Demographics Similar to Spanish by Vision Disability
In terms of vision disability, the demographic groups most similar to Spanish are Nepalese (2.4%, a difference of 0.010%), Cape Verdean (2.4%, a difference of 0.050%), Bahamian (2.4%, a difference of 0.16%), Scotch-Irish (2.4%, a difference of 0.20%), and U.S. Virgin Islander (2.5%, a difference of 0.28%).
| Demographics | Rating | Rank | Vision Disability |
| Immigrants | Azores | 0.1 /100 | #271 | Tragic 2.4% |
| Spaniards | 0.1 /100 | #272 | Tragic 2.4% |
| Immigrants | Bahamas | 0.1 /100 | #273 | Tragic 2.4% |
| Immigrants | Latin America | 0.0 /100 | #274 | Tragic 2.4% |
| Chippewa | 0.0 /100 | #275 | Tragic 2.4% |
| Scotch-Irish | 0.0 /100 | #276 | Tragic 2.4% |
| Bahamians | 0.0 /100 | #277 | Tragic 2.4% |
| Spanish | 0.0 /100 | #278 | Tragic 2.4% |
| Nepalese | 0.0 /100 | #279 | Tragic 2.4% |
| Cape Verdeans | 0.0 /100 | #280 | Tragic 2.4% |
| U.S. Virgin Islanders | 0.0 /100 | #281 | Tragic 2.5% |
| Immigrants | Caribbean | 0.0 /100 | #282 | Tragic 2.5% |
| Puget Sound Salish | 0.0 /100 | #283 | Tragic 2.5% |
| Yakama | 0.0 /100 | #284 | Tragic 2.5% |
| Immigrants | Central America | 0.0 /100 | #285 | Tragic 2.5% |
Demographics Similar to Immigrants from Lithuania by Vision Disability
In terms of vision disability, the demographic groups most similar to Immigrants from Lithuania are Bulgarian (1.9%, a difference of 0.040%), Immigrants from Japan (1.9%, a difference of 0.080%), Immigrants from Asia (1.9%, a difference of 0.12%), Taiwanese (1.9%, a difference of 0.41%), and Immigrants from Malaysia (1.9%, a difference of 0.44%).
| Demographics | Rating | Rank | Vision Disability |
| Burmese | 100.0 /100 | #17 | Exceptional 1.8% |
| Bolivians | 100.0 /100 | #18 | Exceptional 1.9% |
| Immigrants | Sri Lanka | 100.0 /100 | #19 | Exceptional 1.9% |
| Asians | 100.0 /100 | #20 | Exceptional 1.9% |
| Turks | 100.0 /100 | #21 | Exceptional 1.9% |
| Immigrants | Pakistan | 100.0 /100 | #22 | Exceptional 1.9% |
| Immigrants | Asia | 99.9 /100 | #23 | Exceptional 1.9% |
| Immigrants | Lithuania | 99.9 /100 | #24 | Exceptional 1.9% |
| Bulgarians | 99.9 /100 | #25 | Exceptional 1.9% |
| Immigrants | Japan | 99.9 /100 | #26 | Exceptional 1.9% |
| Taiwanese | 99.9 /100 | #27 | Exceptional 1.9% |
| Immigrants | Malaysia | 99.9 /100 | #28 | Exceptional 1.9% |
| Egyptians | 99.9 /100 | #29 | Exceptional 1.9% |
| Immigrants | Nepal | 99.9 /100 | #30 | Exceptional 1.9% |
| Mongolians | 99.9 /100 | #31 | Exceptional 1.9% |