Sri Lankan vs Immigrants from Lithuania Vision Disability
COMPARE
Sri Lankan
Immigrants from Lithuania
Vision Disability
Vision Disability Comparison
Sri Lankans
Immigrants from Lithuania
2.1%
VISION DISABILITY
94.8/ 100
METRIC RATING
102nd/ 347
METRIC RANK
1.9%
VISION DISABILITY
99.9/ 100
METRIC RATING
24th/ 347
METRIC RANK
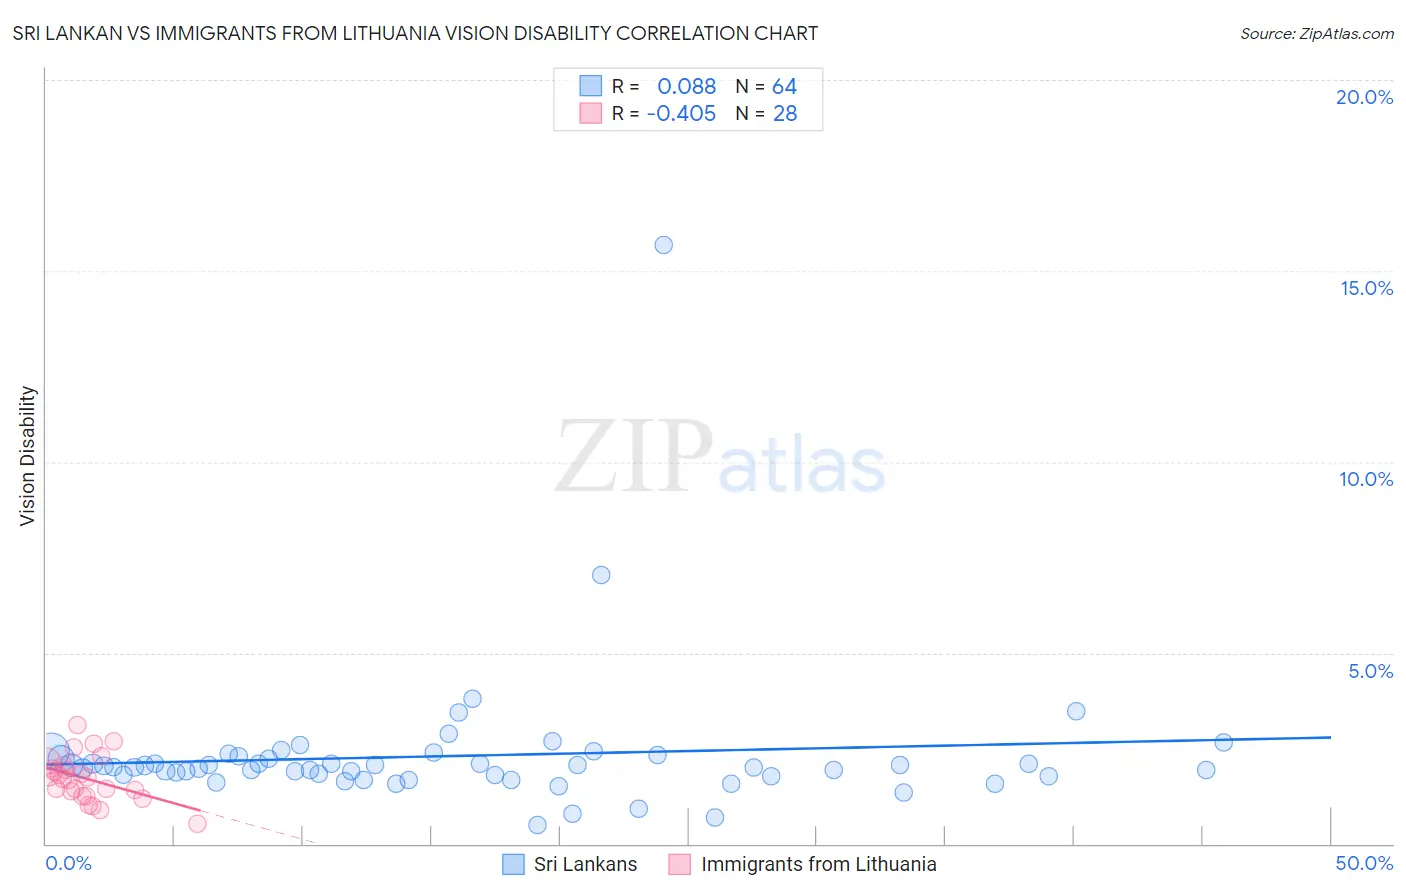
Sri Lankan vs Immigrants from Lithuania Vision Disability Correlation Chart
The statistical analysis conducted on geographies consisting of 440,158,739 people shows a slight positive correlation between the proportion of Sri Lankans and percentage of population with vision disability in the United States with a correlation coefficient (R) of 0.088 and weighted average of 2.1%. Similarly, the statistical analysis conducted on geographies consisting of 117,709,578 people shows a moderate negative correlation between the proportion of Immigrants from Lithuania and percentage of population with vision disability in the United States with a correlation coefficient (R) of -0.405 and weighted average of 1.9%, a difference of 7.7%.
Vision Disability Correlation Summary
| Measurement | Sri Lankan | Immigrants from Lithuania |
| Minimum | 0.49% | 0.53% |
| Maximum | 15.7% | 3.1% |
| Range | 15.2% | 2.6% |
| Mean | 2.3% | 1.7% |
| Median | 2.0% | 1.7% |
| Interquartile 25% (IQ1) | 1.8% | 1.3% |
| Interquartile 75% (IQ3) | 2.3% | 2.0% |
| Interquartile Range (IQR) | 0.48% | 0.69% |
| Standard Deviation (Sample) | 1.9% | 0.59% |
| Standard Deviation (Population) | 1.9% | 0.58% |
Similar Demographics by Vision Disability
Demographics Similar to Sri Lankans by Vision Disability
In terms of vision disability, the demographic groups most similar to Sri Lankans are Albanian (2.1%, a difference of 0.030%), Greek (2.1%, a difference of 0.11%), Immigrants from Austria (2.1%, a difference of 0.14%), Estonian (2.1%, a difference of 0.15%), and Immigrants from Italy (2.1%, a difference of 0.15%).
| Demographics | Rating | Rank | Vision Disability |
| Australians | 95.9 /100 | #95 | Exceptional 2.1% |
| Romanians | 95.7 /100 | #96 | Exceptional 2.1% |
| Immigrants | Afghanistan | 95.6 /100 | #97 | Exceptional 2.1% |
| Immigrants | South Africa | 95.4 /100 | #98 | Exceptional 2.1% |
| Estonians | 95.3 /100 | #99 | Exceptional 2.1% |
| Greeks | 95.1 /100 | #100 | Exceptional 2.1% |
| Albanians | 94.9 /100 | #101 | Exceptional 2.1% |
| Sri Lankans | 94.8 /100 | #102 | Exceptional 2.1% |
| Immigrants | Austria | 94.4 /100 | #103 | Exceptional 2.1% |
| Immigrants | Italy | 94.4 /100 | #104 | Exceptional 2.1% |
| Carpatho Rusyns | 94.3 /100 | #105 | Exceptional 2.1% |
| Swedes | 94.2 /100 | #106 | Exceptional 2.1% |
| Danes | 94.2 /100 | #107 | Exceptional 2.1% |
| Koreans | 94.1 /100 | #108 | Exceptional 2.1% |
| Chileans | 94.0 /100 | #109 | Exceptional 2.1% |
Demographics Similar to Immigrants from Lithuania by Vision Disability
In terms of vision disability, the demographic groups most similar to Immigrants from Lithuania are Bulgarian (1.9%, a difference of 0.040%), Immigrants from Japan (1.9%, a difference of 0.080%), Immigrants from Asia (1.9%, a difference of 0.12%), Taiwanese (1.9%, a difference of 0.41%), and Immigrants from Malaysia (1.9%, a difference of 0.44%).
| Demographics | Rating | Rank | Vision Disability |
| Burmese | 100.0 /100 | #17 | Exceptional 1.8% |
| Bolivians | 100.0 /100 | #18 | Exceptional 1.9% |
| Immigrants | Sri Lanka | 100.0 /100 | #19 | Exceptional 1.9% |
| Asians | 100.0 /100 | #20 | Exceptional 1.9% |
| Turks | 100.0 /100 | #21 | Exceptional 1.9% |
| Immigrants | Pakistan | 100.0 /100 | #22 | Exceptional 1.9% |
| Immigrants | Asia | 99.9 /100 | #23 | Exceptional 1.9% |
| Immigrants | Lithuania | 99.9 /100 | #24 | Exceptional 1.9% |
| Bulgarians | 99.9 /100 | #25 | Exceptional 1.9% |
| Immigrants | Japan | 99.9 /100 | #26 | Exceptional 1.9% |
| Taiwanese | 99.9 /100 | #27 | Exceptional 1.9% |
| Immigrants | Malaysia | 99.9 /100 | #28 | Exceptional 1.9% |
| Egyptians | 99.9 /100 | #29 | Exceptional 1.9% |
| Immigrants | Nepal | 99.9 /100 | #30 | Exceptional 1.9% |
| Mongolians | 99.9 /100 | #31 | Exceptional 1.9% |