Immigrants from Singapore vs Immigrants from Lithuania Vision Disability
COMPARE
Immigrants from Singapore
Immigrants from Lithuania
Vision Disability
Vision Disability Comparison
Immigrants from Singapore
Immigrants from Lithuania
1.8%
VISION DISABILITY
100.0/ 100
METRIC RATING
9th/ 347
METRIC RANK
1.9%
VISION DISABILITY
99.9/ 100
METRIC RATING
24th/ 347
METRIC RANK
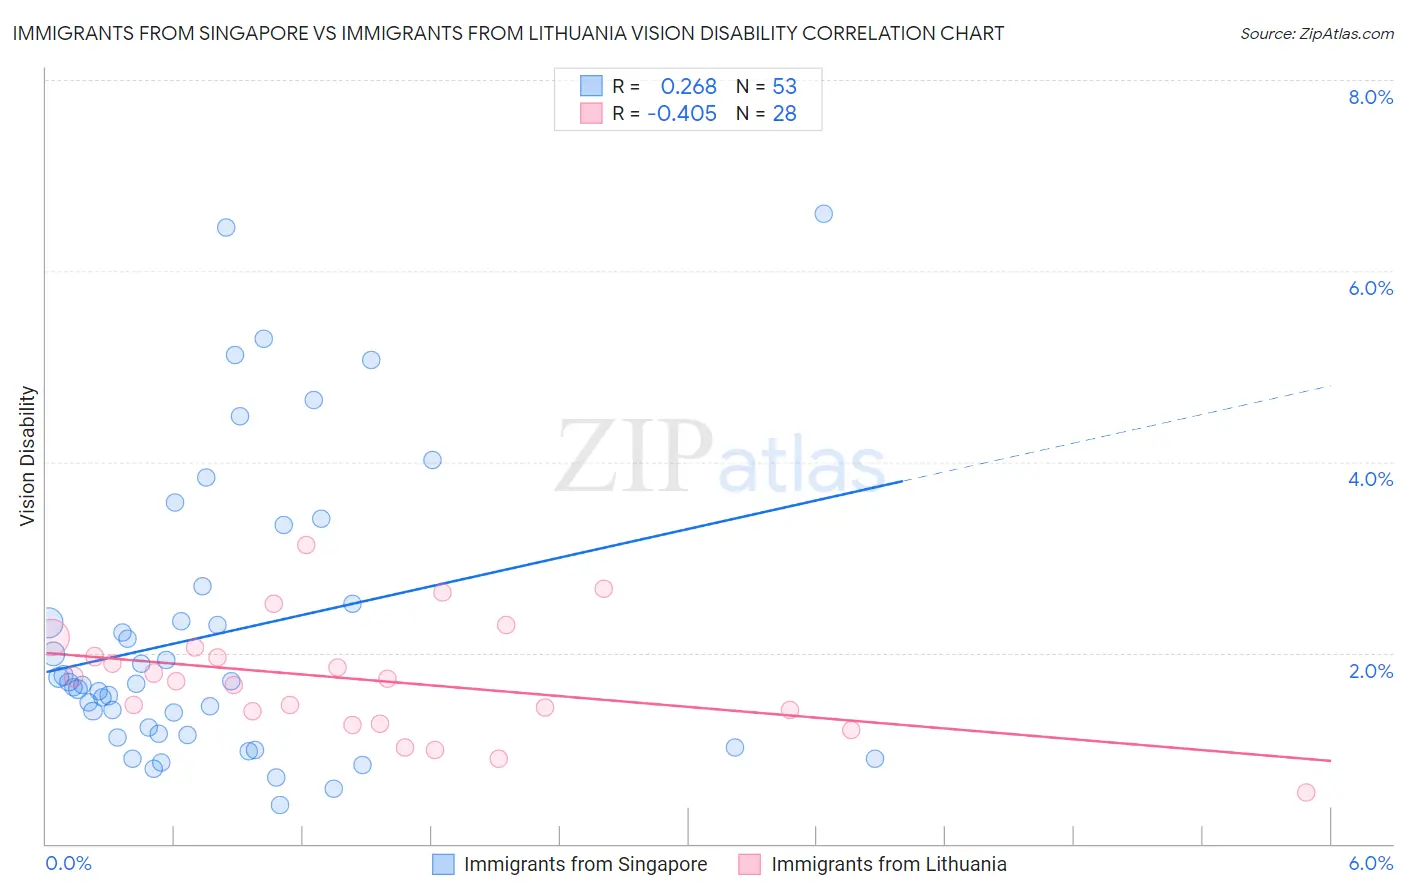
Immigrants from Singapore vs Immigrants from Lithuania Vision Disability Correlation Chart
The statistical analysis conducted on geographies consisting of 137,473,730 people shows a weak positive correlation between the proportion of Immigrants from Singapore and percentage of population with vision disability in the United States with a correlation coefficient (R) of 0.268 and weighted average of 1.8%. Similarly, the statistical analysis conducted on geographies consisting of 117,709,578 people shows a moderate negative correlation between the proportion of Immigrants from Lithuania and percentage of population with vision disability in the United States with a correlation coefficient (R) of -0.405 and weighted average of 1.9%, a difference of 6.6%.
Vision Disability Correlation Summary
| Measurement | Immigrants from Singapore | Immigrants from Lithuania |
| Minimum | 0.40% | 0.53% |
| Maximum | 6.6% | 3.1% |
| Range | 6.2% | 2.6% |
| Mean | 2.2% | 1.7% |
| Median | 1.7% | 1.7% |
| Interquartile 25% (IQ1) | 1.1% | 1.3% |
| Interquartile 75% (IQ3) | 2.6% | 2.0% |
| Interquartile Range (IQR) | 1.5% | 0.69% |
| Standard Deviation (Sample) | 1.5% | 0.59% |
| Standard Deviation (Population) | 1.5% | 0.58% |
Demographics Similar to Immigrants from Singapore and Immigrants from Lithuania by Vision Disability
In terms of vision disability, the demographic groups most similar to Immigrants from Singapore are Immigrants from Hong Kong (1.8%, a difference of 0.19%), Iranian (1.8%, a difference of 0.74%), Immigrants from South Central Asia (1.8%, a difference of 0.89%), Immigrants from Iran (1.8%, a difference of 0.95%), and Immigrants from Israel (1.8%, a difference of 1.3%). Similarly, the demographic groups most similar to Immigrants from Lithuania are Bulgarian (1.9%, a difference of 0.040%), Immigrants from Japan (1.9%, a difference of 0.080%), Immigrants from Asia (1.9%, a difference of 0.12%), Immigrants from Pakistan (1.9%, a difference of 0.66%), and Turkish (1.9%, a difference of 0.71%).
| Demographics | Rating | Rank | Vision Disability |
| Immigrants | Iran | 100.0 /100 | #6 | Exceptional 1.8% |
| Immigrants | South Central Asia | 100.0 /100 | #7 | Exceptional 1.8% |
| Iranians | 100.0 /100 | #8 | Exceptional 1.8% |
| Immigrants | Singapore | 100.0 /100 | #9 | Exceptional 1.8% |
| Immigrants | Hong Kong | 100.0 /100 | #10 | Exceptional 1.8% |
| Immigrants | Israel | 100.0 /100 | #11 | Exceptional 1.8% |
| Immigrants | Korea | 100.0 /100 | #12 | Exceptional 1.8% |
| Immigrants | Eastern Asia | 100.0 /100 | #13 | Exceptional 1.8% |
| Immigrants | China | 100.0 /100 | #14 | Exceptional 1.8% |
| Immigrants | Bolivia | 100.0 /100 | #15 | Exceptional 1.8% |
| Indians (Asian) | 100.0 /100 | #16 | Exceptional 1.8% |
| Burmese | 100.0 /100 | #17 | Exceptional 1.8% |
| Bolivians | 100.0 /100 | #18 | Exceptional 1.9% |
| Immigrants | Sri Lanka | 100.0 /100 | #19 | Exceptional 1.9% |
| Asians | 100.0 /100 | #20 | Exceptional 1.9% |
| Turks | 100.0 /100 | #21 | Exceptional 1.9% |
| Immigrants | Pakistan | 100.0 /100 | #22 | Exceptional 1.9% |
| Immigrants | Asia | 99.9 /100 | #23 | Exceptional 1.9% |
| Immigrants | Lithuania | 99.9 /100 | #24 | Exceptional 1.9% |
| Bulgarians | 99.9 /100 | #25 | Exceptional 1.9% |
| Immigrants | Japan | 99.9 /100 | #26 | Exceptional 1.9% |