Russian vs Immigrants from Zaire Vision Disability
COMPARE
Russian
Immigrants from Zaire
Vision Disability
Vision Disability Comparison
Russians
Immigrants from Zaire
2.0%
VISION DISABILITY
98.6/ 100
METRIC RATING
69th/ 347
METRIC RANK
2.2%
VISION DISABILITY
18.0/ 100
METRIC RATING
202nd/ 347
METRIC RANK
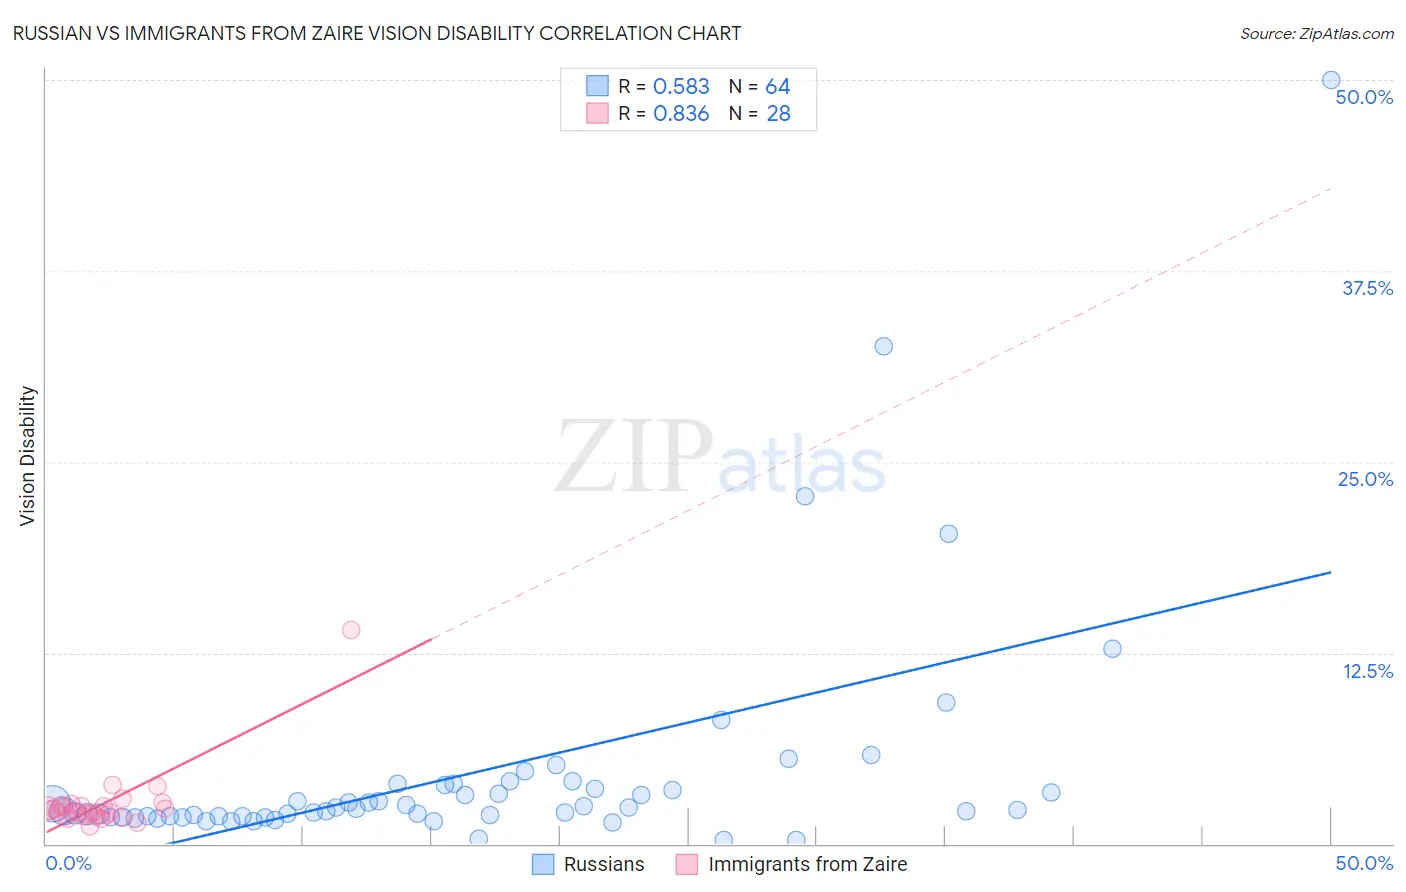
Russian vs Immigrants from Zaire Vision Disability Correlation Chart
The statistical analysis conducted on geographies consisting of 511,148,193 people shows a substantial positive correlation between the proportion of Russians and percentage of population with vision disability in the United States with a correlation coefficient (R) of 0.583 and weighted average of 2.0%. Similarly, the statistical analysis conducted on geographies consisting of 107,249,797 people shows a very strong positive correlation between the proportion of Immigrants from Zaire and percentage of population with vision disability in the United States with a correlation coefficient (R) of 0.836 and weighted average of 2.2%, a difference of 9.7%.
Vision Disability Correlation Summary
| Measurement | Russian | Immigrants from Zaire |
| Minimum | 0.22% | 1.1% |
| Maximum | 50.0% | 14.0% |
| Range | 49.8% | 12.9% |
| Mean | 4.6% | 2.6% |
| Median | 2.2% | 2.1% |
| Interquartile 25% (IQ1) | 1.8% | 1.9% |
| Interquartile 75% (IQ3) | 3.7% | 2.5% |
| Interquartile Range (IQR) | 1.9% | 0.61% |
| Standard Deviation (Sample) | 7.8% | 2.3% |
| Standard Deviation (Population) | 7.8% | 2.3% |
Similar Demographics by Vision Disability
Demographics Similar to Russians by Vision Disability
In terms of vision disability, the demographic groups most similar to Russians are Immigrants from Kazakhstan (2.0%, a difference of 0.020%), Immigrants from Northern Europe (2.0%, a difference of 0.030%), Immigrants from France (2.0%, a difference of 0.080%), Immigrants from Czechoslovakia (2.0%, a difference of 0.17%), and Immigrants from Northern Africa (2.0%, a difference of 0.27%).
| Demographics | Rating | Rank | Vision Disability |
| Immigrants | Russia | 99.1 /100 | #62 | Exceptional 2.0% |
| Armenians | 99.0 /100 | #63 | Exceptional 2.0% |
| Immigrants | Greece | 99.0 /100 | #64 | Exceptional 2.0% |
| Maltese | 98.9 /100 | #65 | Exceptional 2.0% |
| Immigrants | Argentina | 98.9 /100 | #66 | Exceptional 2.0% |
| Immigrants | Northern Africa | 98.8 /100 | #67 | Exceptional 2.0% |
| Immigrants | Czechoslovakia | 98.7 /100 | #68 | Exceptional 2.0% |
| Russians | 98.6 /100 | #69 | Exceptional 2.0% |
| Immigrants | Kazakhstan | 98.6 /100 | #70 | Exceptional 2.0% |
| Immigrants | Northern Europe | 98.6 /100 | #71 | Exceptional 2.0% |
| Immigrants | France | 98.5 /100 | #72 | Exceptional 2.0% |
| Immigrants | Eritrea | 98.4 /100 | #73 | Exceptional 2.0% |
| Palestinians | 98.3 /100 | #74 | Exceptional 2.0% |
| Immigrants | North Macedonia | 98.3 /100 | #75 | Exceptional 2.0% |
| Paraguayans | 98.3 /100 | #76 | Exceptional 2.0% |
Demographics Similar to Immigrants from Zaire by Vision Disability
In terms of vision disability, the demographic groups most similar to Immigrants from Zaire are Slovak (2.2%, a difference of 0.090%), Dutch (2.2%, a difference of 0.10%), Immigrants from Thailand (2.2%, a difference of 0.22%), Immigrants from Guyana (2.2%, a difference of 0.23%), and Samoan (2.2%, a difference of 0.25%).
| Demographics | Rating | Rank | Vision Disability |
| Immigrants | Immigrants | 23.7 /100 | #195 | Fair 2.2% |
| Immigrants | Grenada | 23.1 /100 | #196 | Fair 2.2% |
| Ghanaians | 21.8 /100 | #197 | Fair 2.2% |
| Czechoslovakians | 21.6 /100 | #198 | Fair 2.2% |
| Immigrants | El Salvador | 21.0 /100 | #199 | Fair 2.2% |
| Immigrants | Thailand | 20.1 /100 | #200 | Fair 2.2% |
| Slovaks | 18.8 /100 | #201 | Poor 2.2% |
| Immigrants | Zaire | 18.0 /100 | #202 | Poor 2.2% |
| Dutch | 17.1 /100 | #203 | Poor 2.2% |
| Immigrants | Guyana | 15.9 /100 | #204 | Poor 2.2% |
| Samoans | 15.7 /100 | #205 | Poor 2.2% |
| Pennsylvania Germans | 14.5 /100 | #206 | Poor 2.2% |
| Immigrants | Nigeria | 13.5 /100 | #207 | Poor 2.2% |
| Germans | 13.4 /100 | #208 | Poor 2.2% |
| Immigrants | Brazil | 13.1 /100 | #209 | Poor 2.2% |