Latvian vs Immigrants from Kazakhstan Vision Disability
COMPARE
Latvian
Immigrants from Kazakhstan
Vision Disability
Vision Disability Comparison
Latvians
Immigrants from Kazakhstan
2.0%
VISION DISABILITY
99.5/ 100
METRIC RATING
49th/ 347
METRIC RANK
2.0%
VISION DISABILITY
98.6/ 100
METRIC RATING
70th/ 347
METRIC RANK
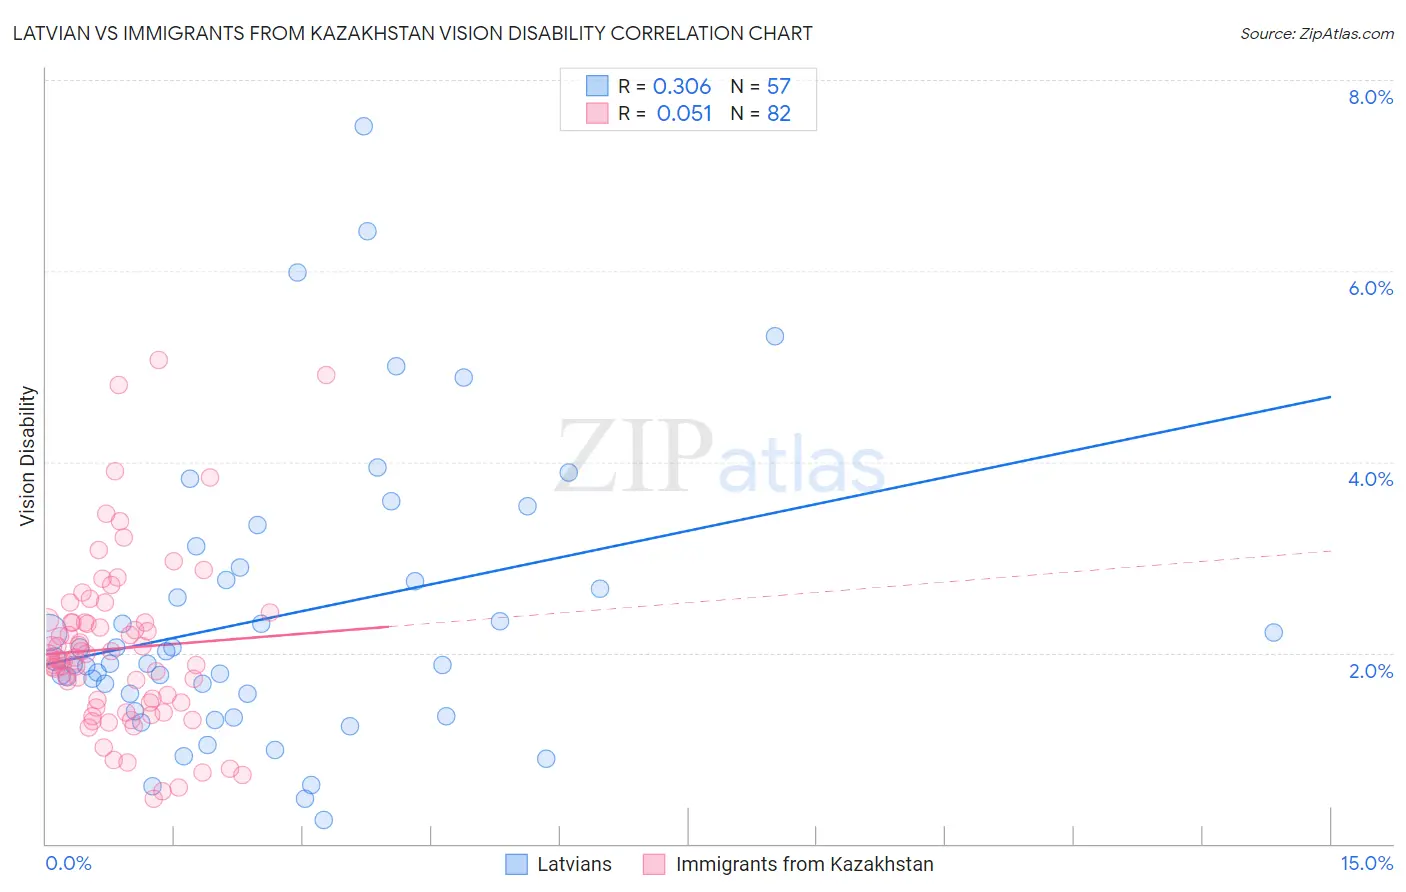
Latvian vs Immigrants from Kazakhstan Vision Disability Correlation Chart
The statistical analysis conducted on geographies consisting of 220,626,631 people shows a mild positive correlation between the proportion of Latvians and percentage of population with vision disability in the United States with a correlation coefficient (R) of 0.306 and weighted average of 2.0%. Similarly, the statistical analysis conducted on geographies consisting of 124,421,317 people shows a slight positive correlation between the proportion of Immigrants from Kazakhstan and percentage of population with vision disability in the United States with a correlation coefficient (R) of 0.051 and weighted average of 2.0%, a difference of 1.9%.
Vision Disability Correlation Summary
| Measurement | Latvian | Immigrants from Kazakhstan |
| Minimum | 0.25% | 0.47% |
| Maximum | 7.5% | 5.1% |
| Range | 7.3% | 4.6% |
| Mean | 2.4% | 2.0% |
| Median | 1.9% | 1.9% |
| Interquartile 25% (IQ1) | 1.5% | 1.5% |
| Interquartile 75% (IQ3) | 2.8% | 2.3% |
| Interquartile Range (IQR) | 1.3% | 0.85% |
| Standard Deviation (Sample) | 1.5% | 0.91% |
| Standard Deviation (Population) | 1.5% | 0.90% |
Similar Demographics by Vision Disability
Demographics Similar to Latvians by Vision Disability
In terms of vision disability, the demographic groups most similar to Latvians are Afghan (2.0%, a difference of 0.060%), Israeli (2.0%, a difference of 0.070%), Tongan (2.0%, a difference of 0.15%), Immigrants from Serbia (2.0%, a difference of 0.46%), and Immigrants from Bulgaria (2.0%, a difference of 0.52%).
| Demographics | Rating | Rank | Vision Disability |
| Immigrants | Ethiopia | 99.7 /100 | #42 | Exceptional 2.0% |
| Eastern Europeans | 99.7 /100 | #43 | Exceptional 2.0% |
| Immigrants | Indonesia | 99.7 /100 | #44 | Exceptional 2.0% |
| Ethiopians | 99.7 /100 | #45 | Exceptional 2.0% |
| Immigrants | Sweden | 99.7 /100 | #46 | Exceptional 2.0% |
| Immigrants | Bulgaria | 99.7 /100 | #47 | Exceptional 2.0% |
| Israelis | 99.6 /100 | #48 | Exceptional 2.0% |
| Latvians | 99.5 /100 | #49 | Exceptional 2.0% |
| Afghans | 99.5 /100 | #50 | Exceptional 2.0% |
| Tongans | 99.5 /100 | #51 | Exceptional 2.0% |
| Immigrants | Serbia | 99.4 /100 | #52 | Exceptional 2.0% |
| Immigrants | Belarus | 99.3 /100 | #53 | Exceptional 2.0% |
| Macedonians | 99.3 /100 | #54 | Exceptional 2.0% |
| Laotians | 99.3 /100 | #55 | Exceptional 2.0% |
| Jordanians | 99.2 /100 | #56 | Exceptional 2.0% |
Demographics Similar to Immigrants from Kazakhstan by Vision Disability
In terms of vision disability, the demographic groups most similar to Immigrants from Kazakhstan are Immigrants from Northern Europe (2.0%, a difference of 0.010%), Russian (2.0%, a difference of 0.020%), Immigrants from France (2.0%, a difference of 0.060%), Immigrants from Czechoslovakia (2.0%, a difference of 0.19%), and Immigrants from Eritrea (2.0%, a difference of 0.26%).
| Demographics | Rating | Rank | Vision Disability |
| Armenians | 99.0 /100 | #63 | Exceptional 2.0% |
| Immigrants | Greece | 99.0 /100 | #64 | Exceptional 2.0% |
| Maltese | 98.9 /100 | #65 | Exceptional 2.0% |
| Immigrants | Argentina | 98.9 /100 | #66 | Exceptional 2.0% |
| Immigrants | Northern Africa | 98.8 /100 | #67 | Exceptional 2.0% |
| Immigrants | Czechoslovakia | 98.7 /100 | #68 | Exceptional 2.0% |
| Russians | 98.6 /100 | #69 | Exceptional 2.0% |
| Immigrants | Kazakhstan | 98.6 /100 | #70 | Exceptional 2.0% |
| Immigrants | Northern Europe | 98.6 /100 | #71 | Exceptional 2.0% |
| Immigrants | France | 98.5 /100 | #72 | Exceptional 2.0% |
| Immigrants | Eritrea | 98.4 /100 | #73 | Exceptional 2.0% |
| Palestinians | 98.3 /100 | #74 | Exceptional 2.0% |
| Immigrants | North Macedonia | 98.3 /100 | #75 | Exceptional 2.0% |
| Paraguayans | 98.3 /100 | #76 | Exceptional 2.0% |
| Immigrants | Jordan | 98.3 /100 | #77 | Exceptional 2.0% |