Nigerian vs Immigrants from Kazakhstan Vision Disability
COMPARE
Nigerian
Immigrants from Kazakhstan
Vision Disability
Vision Disability Comparison
Nigerians
Immigrants from Kazakhstan
2.3%
VISION DISABILITY
7.2/ 100
METRIC RATING
215th/ 347
METRIC RANK
2.0%
VISION DISABILITY
98.6/ 100
METRIC RATING
70th/ 347
METRIC RANK
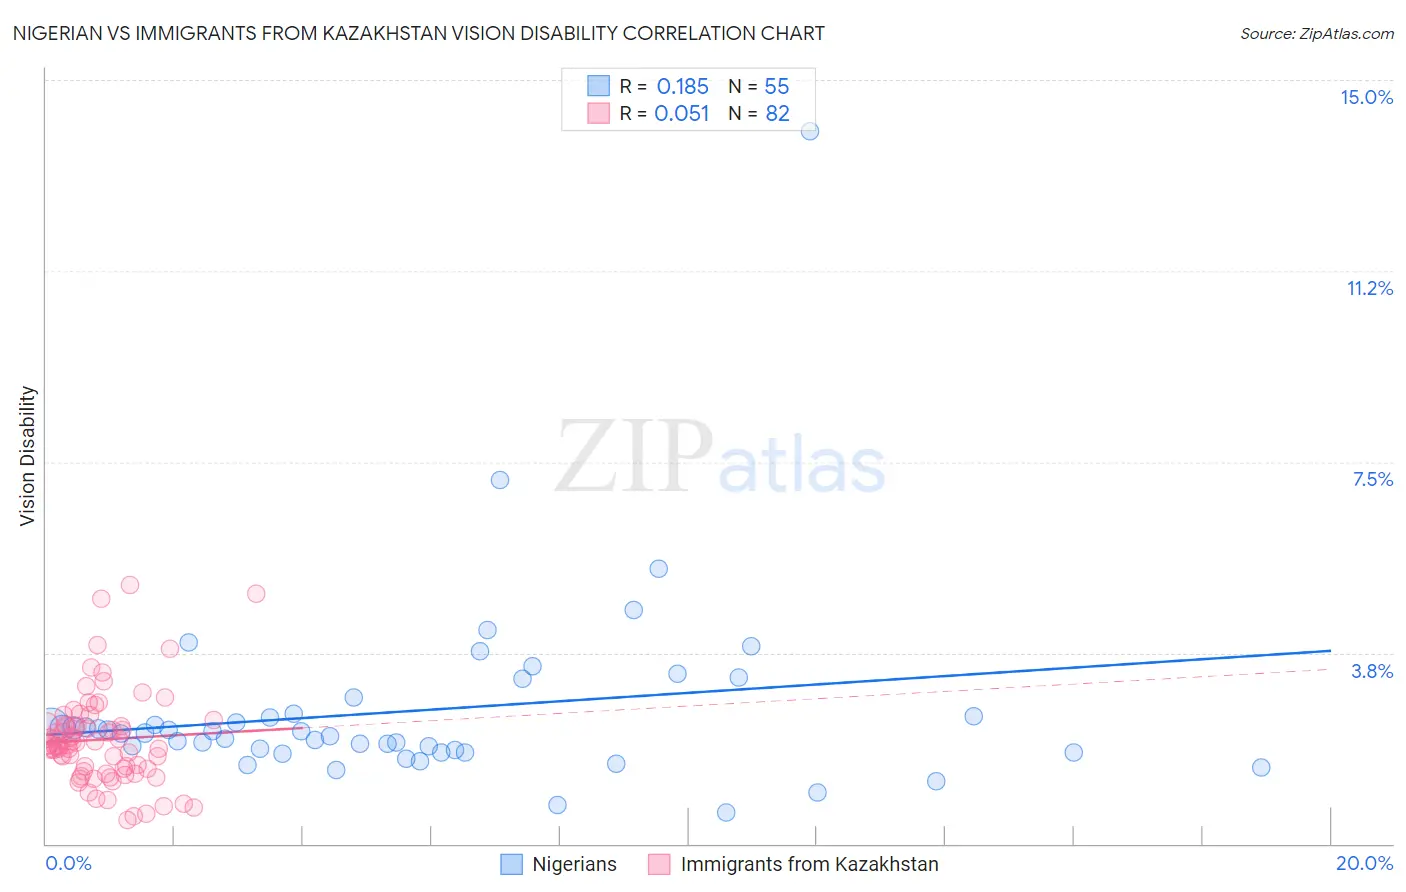
Nigerian vs Immigrants from Kazakhstan Vision Disability Correlation Chart
The statistical analysis conducted on geographies consisting of 332,578,519 people shows a poor positive correlation between the proportion of Nigerians and percentage of population with vision disability in the United States with a correlation coefficient (R) of 0.185 and weighted average of 2.3%. Similarly, the statistical analysis conducted on geographies consisting of 124,421,317 people shows a slight positive correlation between the proportion of Immigrants from Kazakhstan and percentage of population with vision disability in the United States with a correlation coefficient (R) of 0.051 and weighted average of 2.0%, a difference of 11.5%.
Vision Disability Correlation Summary
| Measurement | Nigerian | Immigrants from Kazakhstan |
| Minimum | 0.62% | 0.47% |
| Maximum | 14.0% | 5.1% |
| Range | 13.4% | 4.6% |
| Mean | 2.6% | 2.0% |
| Median | 2.2% | 1.9% |
| Interquartile 25% (IQ1) | 1.8% | 1.5% |
| Interquartile 75% (IQ3) | 2.5% | 2.3% |
| Interquartile Range (IQR) | 0.74% | 0.85% |
| Standard Deviation (Sample) | 1.9% | 0.91% |
| Standard Deviation (Population) | 1.9% | 0.90% |
Similar Demographics by Vision Disability
Demographics Similar to Nigerians by Vision Disability
In terms of vision disability, the demographic groups most similar to Nigerians are Trinidadian and Tobagonian (2.2%, a difference of 0.21%), Immigrants from Trinidad and Tobago (2.3%, a difference of 0.29%), Immigrants from Ghana (2.2%, a difference of 0.34%), Bermudan (2.2%, a difference of 0.35%), and Indonesian (2.2%, a difference of 0.44%).
| Demographics | Rating | Rank | Vision Disability |
| Germans | 13.4 /100 | #208 | Poor 2.2% |
| Immigrants | Brazil | 13.1 /100 | #209 | Poor 2.2% |
| Immigrants | Uruguay | 11.5 /100 | #210 | Poor 2.2% |
| Indonesians | 9.5 /100 | #211 | Tragic 2.2% |
| Bermudans | 9.0 /100 | #212 | Tragic 2.2% |
| Immigrants | Ghana | 8.9 /100 | #213 | Tragic 2.2% |
| Trinidadians and Tobagonians | 8.2 /100 | #214 | Tragic 2.2% |
| Nigerians | 7.2 /100 | #215 | Tragic 2.3% |
| Immigrants | Trinidad and Tobago | 6.1 /100 | #216 | Tragic 2.3% |
| Barbadians | 5.1 /100 | #217 | Tragic 2.3% |
| Portuguese | 4.9 /100 | #218 | Tragic 2.3% |
| Ecuadorians | 4.6 /100 | #219 | Tragic 2.3% |
| Guamanians/Chamorros | 3.9 /100 | #220 | Tragic 2.3% |
| French Canadians | 3.9 /100 | #221 | Tragic 2.3% |
| Immigrants | Senegal | 3.8 /100 | #222 | Tragic 2.3% |
Demographics Similar to Immigrants from Kazakhstan by Vision Disability
In terms of vision disability, the demographic groups most similar to Immigrants from Kazakhstan are Immigrants from Northern Europe (2.0%, a difference of 0.010%), Russian (2.0%, a difference of 0.020%), Immigrants from France (2.0%, a difference of 0.060%), Immigrants from Czechoslovakia (2.0%, a difference of 0.19%), and Immigrants from Eritrea (2.0%, a difference of 0.26%).
| Demographics | Rating | Rank | Vision Disability |
| Armenians | 99.0 /100 | #63 | Exceptional 2.0% |
| Immigrants | Greece | 99.0 /100 | #64 | Exceptional 2.0% |
| Maltese | 98.9 /100 | #65 | Exceptional 2.0% |
| Immigrants | Argentina | 98.9 /100 | #66 | Exceptional 2.0% |
| Immigrants | Northern Africa | 98.8 /100 | #67 | Exceptional 2.0% |
| Immigrants | Czechoslovakia | 98.7 /100 | #68 | Exceptional 2.0% |
| Russians | 98.6 /100 | #69 | Exceptional 2.0% |
| Immigrants | Kazakhstan | 98.6 /100 | #70 | Exceptional 2.0% |
| Immigrants | Northern Europe | 98.6 /100 | #71 | Exceptional 2.0% |
| Immigrants | France | 98.5 /100 | #72 | Exceptional 2.0% |
| Immigrants | Eritrea | 98.4 /100 | #73 | Exceptional 2.0% |
| Palestinians | 98.3 /100 | #74 | Exceptional 2.0% |
| Immigrants | North Macedonia | 98.3 /100 | #75 | Exceptional 2.0% |
| Paraguayans | 98.3 /100 | #76 | Exceptional 2.0% |
| Immigrants | Jordan | 98.3 /100 | #77 | Exceptional 2.0% |