Russian vs Immigrants from Kazakhstan Female Poverty Among 25-34 Year Olds
COMPARE
Russian
Immigrants from Kazakhstan
Female Poverty Among 25-34 Year Olds
Female Poverty Among 25-34 Year Olds Comparison
Russians
Immigrants from Kazakhstan
12.1%
FEMALE POVERTY AMONG 25-34 YEAR OLDS
99.4/ 100
METRIC RATING
59th/ 347
METRIC RANK
12.4%
FEMALE POVERTY AMONG 25-34 YEAR OLDS
98.1/ 100
METRIC RATING
81st/ 347
METRIC RANK
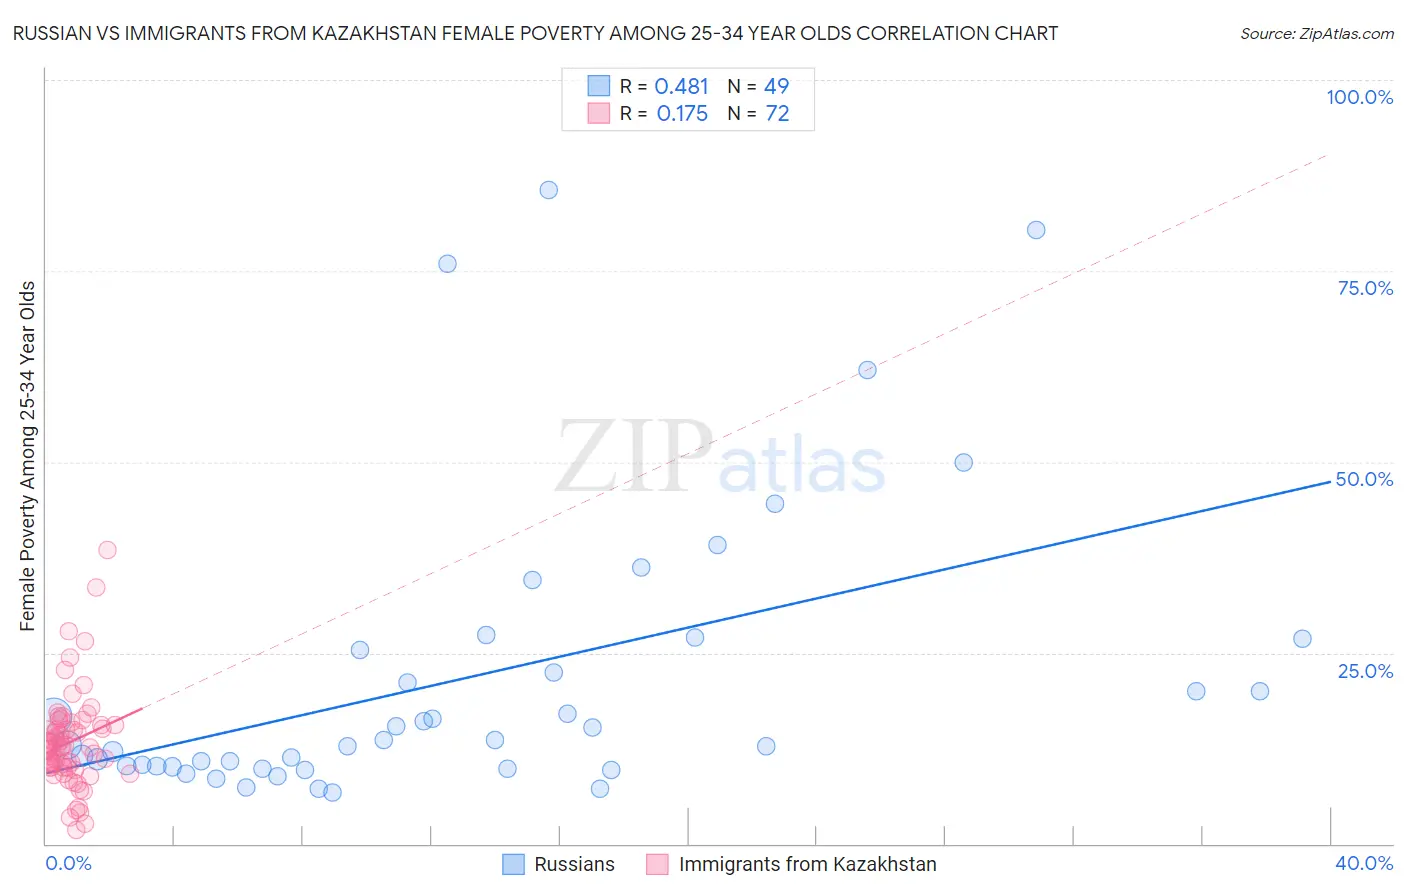
Russian vs Immigrants from Kazakhstan Female Poverty Among 25-34 Year Olds Correlation Chart
The statistical analysis conducted on geographies consisting of 496,430,751 people shows a moderate positive correlation between the proportion of Russians and poverty level among females between the ages 25 and 34 in the United States with a correlation coefficient (R) of 0.481 and weighted average of 12.1%. Similarly, the statistical analysis conducted on geographies consisting of 123,655,702 people shows a poor positive correlation between the proportion of Immigrants from Kazakhstan and poverty level among females between the ages 25 and 34 in the United States with a correlation coefficient (R) of 0.175 and weighted average of 12.4%, a difference of 2.7%.
Female Poverty Among 25-34 Year Olds Correlation Summary
| Measurement | Russian | Immigrants from Kazakhstan |
| Minimum | 6.7% | 1.8% |
| Maximum | 85.5% | 38.5% |
| Range | 78.9% | 36.6% |
| Mean | 21.7% | 13.3% |
| Median | 13.5% | 12.7% |
| Interquartile 25% (IQ1) | 10.1% | 10.0% |
| Interquartile 75% (IQ3) | 26.1% | 15.5% |
| Interquartile Range (IQR) | 16.0% | 5.5% |
| Standard Deviation (Sample) | 19.3% | 6.3% |
| Standard Deviation (Population) | 19.1% | 6.3% |
Similar Demographics by Female Poverty Among 25-34 Year Olds
Demographics Similar to Russians by Female Poverty Among 25-34 Year Olds
In terms of female poverty among 25-34 year olds, the demographic groups most similar to Russians are Immigrants from Romania (12.1%, a difference of 0.0%), Immigrants from Northern Europe (12.1%, a difference of 0.090%), Immigrants from Czechoslovakia (12.1%, a difference of 0.11%), Jordanian (12.1%, a difference of 0.21%), and Luxembourger (12.1%, a difference of 0.23%).
| Demographics | Rating | Rank | Female Poverty Among 25-34 Year Olds |
| Immigrants | Eastern Europe | 99.6 /100 | #52 | Exceptional 12.0% |
| Immigrants | Israel | 99.6 /100 | #53 | Exceptional 12.0% |
| Eastern Europeans | 99.6 /100 | #54 | Exceptional 12.0% |
| Immigrants | Philippines | 99.5 /100 | #55 | Exceptional 12.0% |
| Luxembourgers | 99.5 /100 | #56 | Exceptional 12.1% |
| Jordanians | 99.4 /100 | #57 | Exceptional 12.1% |
| Immigrants | Romania | 99.4 /100 | #58 | Exceptional 12.1% |
| Russians | 99.4 /100 | #59 | Exceptional 12.1% |
| Immigrants | Northern Europe | 99.4 /100 | #60 | Exceptional 12.1% |
| Immigrants | Czechoslovakia | 99.4 /100 | #61 | Exceptional 12.1% |
| Immigrants | Moldova | 99.3 /100 | #62 | Exceptional 12.1% |
| Soviet Union | 99.3 /100 | #63 | Exceptional 12.1% |
| Immigrants | Russia | 99.2 /100 | #64 | Exceptional 12.2% |
| Armenians | 99.2 /100 | #65 | Exceptional 12.2% |
| Immigrants | Europe | 99.2 /100 | #66 | Exceptional 12.2% |
Demographics Similar to Immigrants from Kazakhstan by Female Poverty Among 25-34 Year Olds
In terms of female poverty among 25-34 year olds, the demographic groups most similar to Immigrants from Kazakhstan are Ethiopian (12.4%, a difference of 0.080%), Immigrants from Malaysia (12.4%, a difference of 0.24%), Albanian (12.5%, a difference of 0.40%), Immigrants from Latvia (12.5%, a difference of 0.46%), and Immigrants from Jordan (12.4%, a difference of 0.51%).
| Demographics | Rating | Rank | Female Poverty Among 25-34 Year Olds |
| Immigrants | Sweden | 98.9 /100 | #74 | Exceptional 12.3% |
| Estonians | 98.9 /100 | #75 | Exceptional 12.3% |
| Greeks | 98.9 /100 | #76 | Exceptional 12.3% |
| Immigrants | Italy | 98.8 /100 | #77 | Exceptional 12.3% |
| Immigrants | Ukraine | 98.6 /100 | #78 | Exceptional 12.3% |
| Immigrants | Jordan | 98.5 /100 | #79 | Exceptional 12.4% |
| Immigrants | Malaysia | 98.3 /100 | #80 | Exceptional 12.4% |
| Immigrants | Kazakhstan | 98.1 /100 | #81 | Exceptional 12.4% |
| Ethiopians | 98.0 /100 | #82 | Exceptional 12.4% |
| Albanians | 97.7 /100 | #83 | Exceptional 12.5% |
| Immigrants | Latvia | 97.7 /100 | #84 | Exceptional 12.5% |
| Immigrants | South Eastern Asia | 97.6 /100 | #85 | Exceptional 12.5% |
| Croatians | 97.5 /100 | #86 | Exceptional 12.5% |
| Argentineans | 97.5 /100 | #87 | Exceptional 12.5% |
| Immigrants | Austria | 97.4 /100 | #88 | Exceptional 12.5% |