Menominee vs Immigrants from Kazakhstan Vision Disability
COMPARE
Menominee
Immigrants from Kazakhstan
Vision Disability
Vision Disability Comparison
Menominee
Immigrants from Kazakhstan
2.5%
VISION DISABILITY
0.0/ 100
METRIC RATING
301st/ 347
METRIC RANK
2.0%
VISION DISABILITY
98.6/ 100
METRIC RATING
70th/ 347
METRIC RANK
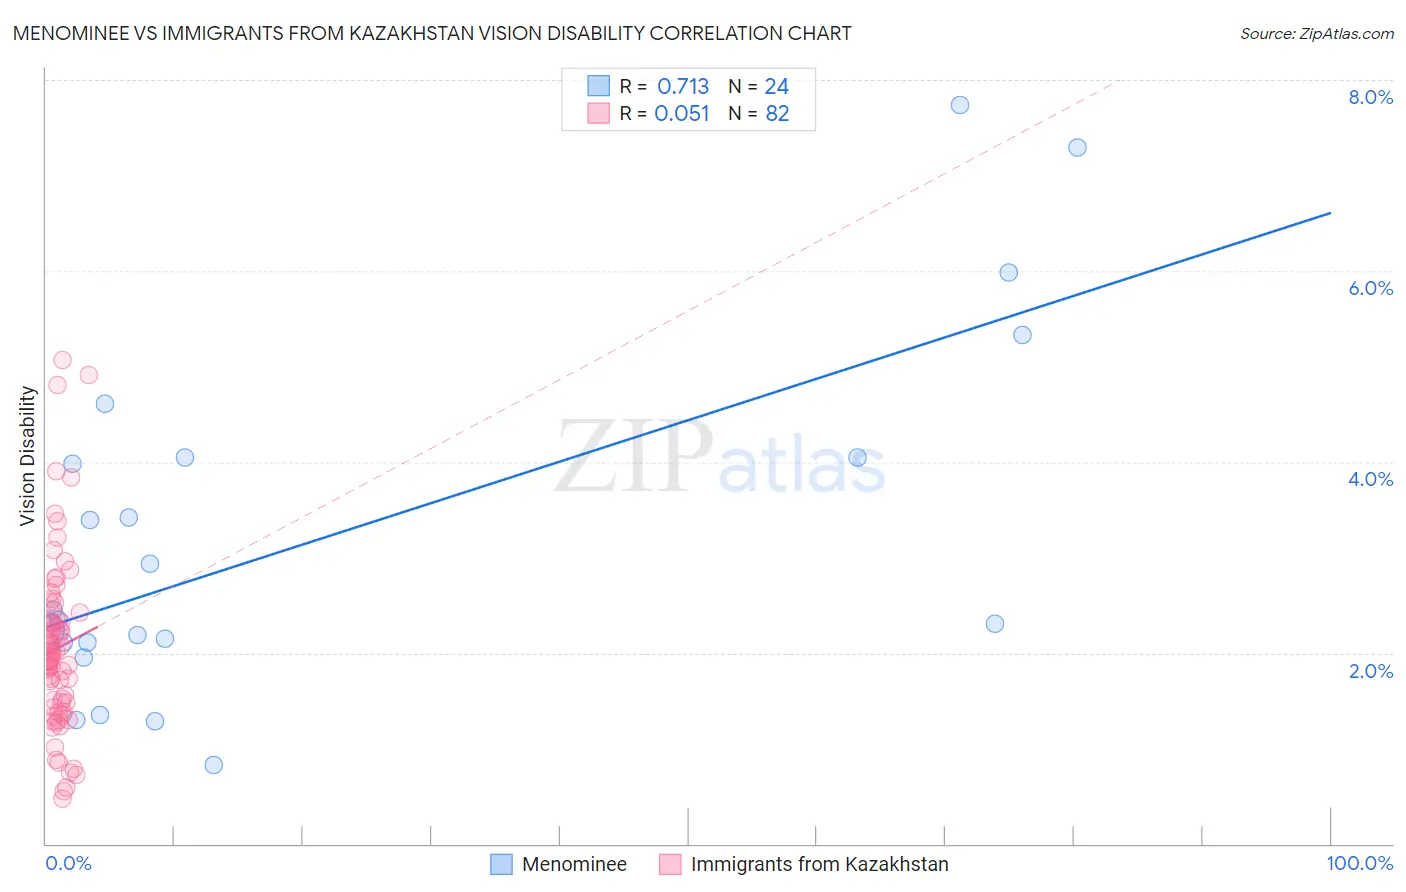
Menominee vs Immigrants from Kazakhstan Vision Disability Correlation Chart
The statistical analysis conducted on geographies consisting of 45,774,970 people shows a strong positive correlation between the proportion of Menominee and percentage of population with vision disability in the United States with a correlation coefficient (R) of 0.713 and weighted average of 2.5%. Similarly, the statistical analysis conducted on geographies consisting of 124,421,317 people shows a slight positive correlation between the proportion of Immigrants from Kazakhstan and percentage of population with vision disability in the United States with a correlation coefficient (R) of 0.051 and weighted average of 2.0%, a difference of 25.8%.
Vision Disability Correlation Summary
| Measurement | Menominee | Immigrants from Kazakhstan |
| Minimum | 0.83% | 0.47% |
| Maximum | 7.7% | 5.1% |
| Range | 6.9% | 4.6% |
| Mean | 3.2% | 2.0% |
| Median | 2.4% | 1.9% |
| Interquartile 25% (IQ1) | 2.1% | 1.5% |
| Interquartile 75% (IQ3) | 4.0% | 2.3% |
| Interquartile Range (IQR) | 1.9% | 0.85% |
| Standard Deviation (Sample) | 1.9% | 0.91% |
| Standard Deviation (Population) | 1.8% | 0.90% |
Similar Demographics by Vision Disability
Demographics Similar to Menominee by Vision Disability
In terms of vision disability, the demographic groups most similar to Menominee are African (2.5%, a difference of 0.18%), Cree (2.5%, a difference of 0.38%), Mexican (2.5%, a difference of 0.41%), Immigrants from Dominica (2.5%, a difference of 0.55%), and Immigrants from Mexico (2.5%, a difference of 1.2%).
| Demographics | Rating | Rank | Vision Disability |
| Ottawa | 0.0 /100 | #294 | Tragic 2.5% |
| Delaware | 0.0 /100 | #295 | Tragic 2.5% |
| Immigrants | Mexico | 0.0 /100 | #296 | Tragic 2.5% |
| Immigrants | Dominica | 0.0 /100 | #297 | Tragic 2.5% |
| Mexicans | 0.0 /100 | #298 | Tragic 2.5% |
| Cree | 0.0 /100 | #299 | Tragic 2.5% |
| Africans | 0.0 /100 | #300 | Tragic 2.5% |
| Menominee | 0.0 /100 | #301 | Tragic 2.5% |
| Spanish American Indians | 0.0 /100 | #302 | Tragic 2.6% |
| Immigrants | Cabo Verde | 0.0 /100 | #303 | Tragic 2.6% |
| Aleuts | 0.0 /100 | #304 | Tragic 2.6% |
| Hispanics or Latinos | 0.0 /100 | #305 | Tragic 2.6% |
| Iroquois | 0.0 /100 | #306 | Tragic 2.6% |
| Immigrants | Dominican Republic | 0.0 /100 | #307 | Tragic 2.6% |
| Arapaho | 0.0 /100 | #308 | Tragic 2.6% |
Demographics Similar to Immigrants from Kazakhstan by Vision Disability
In terms of vision disability, the demographic groups most similar to Immigrants from Kazakhstan are Immigrants from Northern Europe (2.0%, a difference of 0.010%), Russian (2.0%, a difference of 0.020%), Immigrants from France (2.0%, a difference of 0.060%), Immigrants from Czechoslovakia (2.0%, a difference of 0.19%), and Immigrants from Eritrea (2.0%, a difference of 0.26%).
| Demographics | Rating | Rank | Vision Disability |
| Armenians | 99.0 /100 | #63 | Exceptional 2.0% |
| Immigrants | Greece | 99.0 /100 | #64 | Exceptional 2.0% |
| Maltese | 98.9 /100 | #65 | Exceptional 2.0% |
| Immigrants | Argentina | 98.9 /100 | #66 | Exceptional 2.0% |
| Immigrants | Northern Africa | 98.8 /100 | #67 | Exceptional 2.0% |
| Immigrants | Czechoslovakia | 98.7 /100 | #68 | Exceptional 2.0% |
| Russians | 98.6 /100 | #69 | Exceptional 2.0% |
| Immigrants | Kazakhstan | 98.6 /100 | #70 | Exceptional 2.0% |
| Immigrants | Northern Europe | 98.6 /100 | #71 | Exceptional 2.0% |
| Immigrants | France | 98.5 /100 | #72 | Exceptional 2.0% |
| Immigrants | Eritrea | 98.4 /100 | #73 | Exceptional 2.0% |
| Palestinians | 98.3 /100 | #74 | Exceptional 2.0% |
| Immigrants | North Macedonia | 98.3 /100 | #75 | Exceptional 2.0% |
| Paraguayans | 98.3 /100 | #76 | Exceptional 2.0% |
| Immigrants | Jordan | 98.3 /100 | #77 | Exceptional 2.0% |