Nonimmigrants vs Immigrants from Kazakhstan Vision Disability
COMPARE
Nonimmigrants
Immigrants from Kazakhstan
Vision Disability
Vision Disability Comparison
Nonimmigrants
Immigrants from Kazakhstan
2.5%
VISION DISABILITY
0.0/ 100
METRIC RATING
289th/ 347
METRIC RANK
2.0%
VISION DISABILITY
98.6/ 100
METRIC RATING
70th/ 347
METRIC RANK
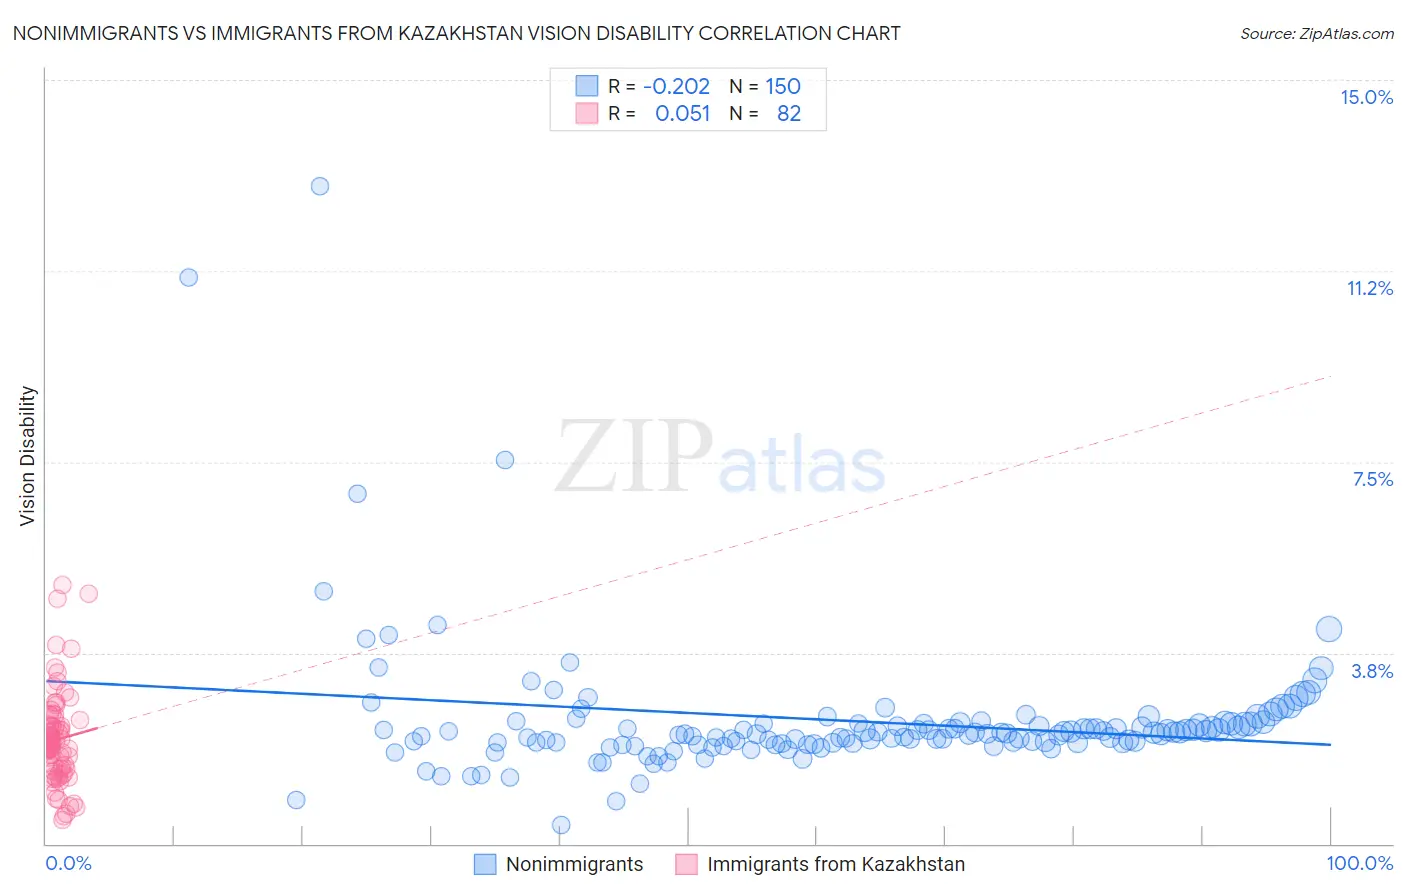
Nonimmigrants vs Immigrants from Kazakhstan Vision Disability Correlation Chart
The statistical analysis conducted on geographies consisting of 581,859,538 people shows a weak negative correlation between the proportion of Nonimmigrants and percentage of population with vision disability in the United States with a correlation coefficient (R) of -0.202 and weighted average of 2.5%. Similarly, the statistical analysis conducted on geographies consisting of 124,421,317 people shows a slight positive correlation between the proportion of Immigrants from Kazakhstan and percentage of population with vision disability in the United States with a correlation coefficient (R) of 0.051 and weighted average of 2.0%, a difference of 22.7%.
Vision Disability Correlation Summary
| Measurement | Nonimmigrants | Immigrants from Kazakhstan |
| Minimum | 0.37% | 0.47% |
| Maximum | 12.9% | 5.1% |
| Range | 12.5% | 4.6% |
| Mean | 2.4% | 2.0% |
| Median | 2.2% | 1.9% |
| Interquartile 25% (IQ1) | 2.0% | 1.5% |
| Interquartile 75% (IQ3) | 2.4% | 2.3% |
| Interquartile Range (IQR) | 0.38% | 0.85% |
| Standard Deviation (Sample) | 1.4% | 0.91% |
| Standard Deviation (Population) | 1.4% | 0.90% |
Similar Demographics by Vision Disability
Demographics Similar to Nonimmigrants by Vision Disability
In terms of vision disability, the demographic groups most similar to Nonimmigrants are Immigrants from Cuba (2.5%, a difference of 0.14%), French American Indian (2.5%, a difference of 0.41%), Honduran (2.5%, a difference of 0.43%), Immigrants from Honduras (2.5%, a difference of 0.53%), and Sioux (2.5%, a difference of 0.57%).
| Demographics | Rating | Rank | Vision Disability |
| Immigrants | Caribbean | 0.0 /100 | #282 | Tragic 2.5% |
| Puget Sound Salish | 0.0 /100 | #283 | Tragic 2.5% |
| Yakama | 0.0 /100 | #284 | Tragic 2.5% |
| Immigrants | Central America | 0.0 /100 | #285 | Tragic 2.5% |
| Sioux | 0.0 /100 | #286 | Tragic 2.5% |
| Hondurans | 0.0 /100 | #287 | Tragic 2.5% |
| French American Indians | 0.0 /100 | #288 | Tragic 2.5% |
| Immigrants | Nonimmigrants | 0.0 /100 | #289 | Tragic 2.5% |
| Immigrants | Cuba | 0.0 /100 | #290 | Tragic 2.5% |
| Immigrants | Honduras | 0.0 /100 | #291 | Tragic 2.5% |
| Crow | 0.0 /100 | #292 | Tragic 2.5% |
| Yaqui | 0.0 /100 | #293 | Tragic 2.5% |
| Ottawa | 0.0 /100 | #294 | Tragic 2.5% |
| Delaware | 0.0 /100 | #295 | Tragic 2.5% |
| Immigrants | Mexico | 0.0 /100 | #296 | Tragic 2.5% |
Demographics Similar to Immigrants from Kazakhstan by Vision Disability
In terms of vision disability, the demographic groups most similar to Immigrants from Kazakhstan are Immigrants from Northern Europe (2.0%, a difference of 0.010%), Russian (2.0%, a difference of 0.020%), Immigrants from France (2.0%, a difference of 0.060%), Immigrants from Czechoslovakia (2.0%, a difference of 0.19%), and Immigrants from Eritrea (2.0%, a difference of 0.26%).
| Demographics | Rating | Rank | Vision Disability |
| Armenians | 99.0 /100 | #63 | Exceptional 2.0% |
| Immigrants | Greece | 99.0 /100 | #64 | Exceptional 2.0% |
| Maltese | 98.9 /100 | #65 | Exceptional 2.0% |
| Immigrants | Argentina | 98.9 /100 | #66 | Exceptional 2.0% |
| Immigrants | Northern Africa | 98.8 /100 | #67 | Exceptional 2.0% |
| Immigrants | Czechoslovakia | 98.7 /100 | #68 | Exceptional 2.0% |
| Russians | 98.6 /100 | #69 | Exceptional 2.0% |
| Immigrants | Kazakhstan | 98.6 /100 | #70 | Exceptional 2.0% |
| Immigrants | Northern Europe | 98.6 /100 | #71 | Exceptional 2.0% |
| Immigrants | France | 98.5 /100 | #72 | Exceptional 2.0% |
| Immigrants | Eritrea | 98.4 /100 | #73 | Exceptional 2.0% |
| Palestinians | 98.3 /100 | #74 | Exceptional 2.0% |
| Immigrants | North Macedonia | 98.3 /100 | #75 | Exceptional 2.0% |
| Paraguayans | 98.3 /100 | #76 | Exceptional 2.0% |
| Immigrants | Jordan | 98.3 /100 | #77 | Exceptional 2.0% |