Puget Sound Salish vs Italian Female Disability
COMPARE
Puget Sound Salish
Italian
Female Disability
Female Disability Comparison
Puget Sound Salish
Italians
13.8%
FEMALE DISABILITY
0.0/ 100
METRIC RATING
314th/ 347
METRIC RANK
12.4%
FEMALE DISABILITY
10.7/ 100
METRIC RATING
222nd/ 347
METRIC RANK
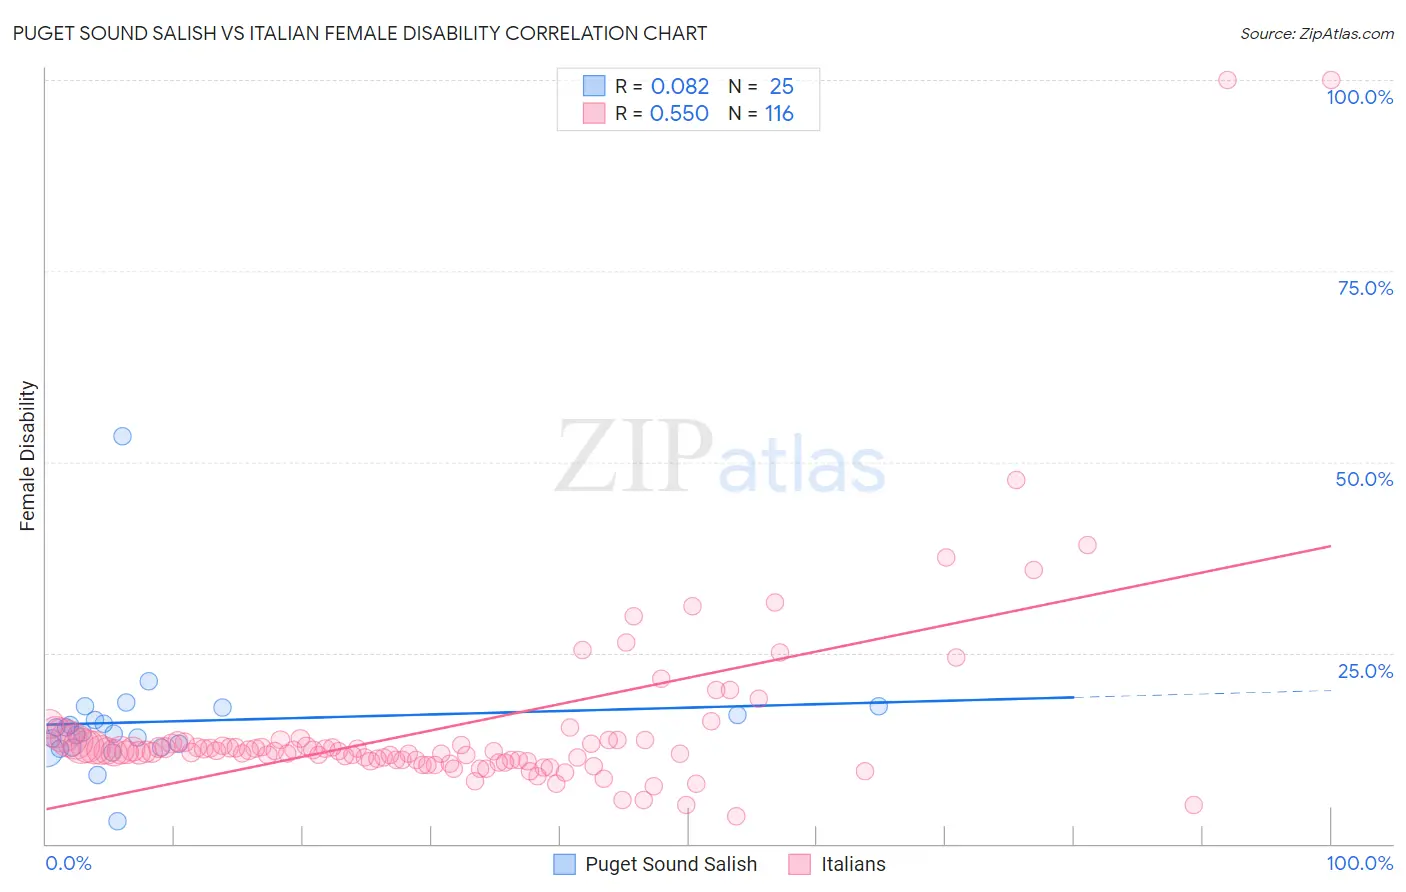
Puget Sound Salish vs Italian Female Disability Correlation Chart
The statistical analysis conducted on geographies consisting of 46,152,398 people shows a slight positive correlation between the proportion of Puget Sound Salish and percentage of females with a disability in the United States with a correlation coefficient (R) of 0.082 and weighted average of 13.8%. Similarly, the statistical analysis conducted on geographies consisting of 574,730,286 people shows a substantial positive correlation between the proportion of Italians and percentage of females with a disability in the United States with a correlation coefficient (R) of 0.550 and weighted average of 12.4%, a difference of 11.3%.
Female Disability Correlation Summary
| Measurement | Puget Sound Salish | Italian |
| Minimum | 2.9% | 3.6% |
| Maximum | 53.3% | 100.0% |
| Range | 50.4% | 96.4% |
| Mean | 16.0% | 15.2% |
| Median | 14.5% | 12.2% |
| Interquartile 25% (IQ1) | 12.6% | 11.0% |
| Interquartile 75% (IQ3) | 17.4% | 13.4% |
| Interquartile Range (IQR) | 4.7% | 2.4% |
| Standard Deviation (Sample) | 8.5% | 13.2% |
| Standard Deviation (Population) | 8.4% | 13.1% |
Similar Demographics by Female Disability
Demographics Similar to Puget Sound Salish by Female Disability
In terms of female disability, the demographic groups most similar to Puget Sound Salish are Blackfeet (13.8%, a difference of 0.10%), Delaware (13.8%, a difference of 0.42%), Alaskan Athabascan (13.9%, a difference of 0.59%), Hopi (13.7%, a difference of 0.73%), and Spanish American (14.0%, a difference of 0.95%).
| Demographics | Rating | Rank | Female Disability |
| Central American Indians | 0.0 /100 | #307 | Tragic 13.6% |
| Cree | 0.0 /100 | #308 | Tragic 13.7% |
| French American Indians | 0.0 /100 | #309 | Tragic 13.7% |
| Apache | 0.0 /100 | #310 | Tragic 13.7% |
| Hopi | 0.0 /100 | #311 | Tragic 13.7% |
| Delaware | 0.0 /100 | #312 | Tragic 13.8% |
| Blackfeet | 0.0 /100 | #313 | Tragic 13.8% |
| Puget Sound Salish | 0.0 /100 | #314 | Tragic 13.8% |
| Alaskan Athabascans | 0.0 /100 | #315 | Tragic 13.9% |
| Spanish Americans | 0.0 /100 | #316 | Tragic 14.0% |
| Chippewa | 0.0 /100 | #317 | Tragic 14.0% |
| Paiute | 0.0 /100 | #318 | Tragic 14.0% |
| Iroquois | 0.0 /100 | #319 | Tragic 14.0% |
| Americans | 0.0 /100 | #320 | Tragic 14.1% |
| Potawatomi | 0.0 /100 | #321 | Tragic 14.1% |
Demographics Similar to Italians by Female Disability
In terms of female disability, the demographic groups most similar to Italians are Native Hawaiian (12.4%, a difference of 0.010%), Bahamian (12.4%, a difference of 0.040%), European (12.4%, a difference of 0.13%), Guamanian/Chamorro (12.5%, a difference of 0.13%), and Belizean (12.5%, a difference of 0.14%).
| Demographics | Rating | Rank | Female Disability |
| Samoans | 13.4 /100 | #215 | Poor 12.4% |
| Immigrants | Burma/Myanmar | 13.3 /100 | #216 | Poor 12.4% |
| British | 12.7 /100 | #217 | Poor 12.4% |
| Immigrants | Bahamas | 12.5 /100 | #218 | Poor 12.4% |
| Europeans | 12.1 /100 | #219 | Poor 12.4% |
| Bahamians | 11.1 /100 | #220 | Poor 12.4% |
| Native Hawaiians | 10.8 /100 | #221 | Poor 12.4% |
| Italians | 10.7 /100 | #222 | Poor 12.4% |
| Guamanians/Chamorros | 9.5 /100 | #223 | Tragic 12.5% |
| Belizeans | 9.3 /100 | #224 | Tragic 12.5% |
| Poles | 8.4 /100 | #225 | Tragic 12.5% |
| Hispanics or Latinos | 8.0 /100 | #226 | Tragic 12.5% |
| Assyrians/Chaldeans/Syriacs | 8.0 /100 | #227 | Tragic 12.5% |
| Immigrants | Cambodia | 7.8 /100 | #228 | Tragic 12.5% |
| Hungarians | 7.2 /100 | #229 | Tragic 12.5% |