Puget Sound Salish vs Immigrants from Northern Africa Female Disability
COMPARE
Puget Sound Salish
Immigrants from Northern Africa
Female Disability
Female Disability Comparison
Puget Sound Salish
Immigrants from Northern Africa
13.8%
FEMALE DISABILITY
0.0/ 100
METRIC RATING
314th/ 347
METRIC RANK
11.5%
FEMALE DISABILITY
99.8/ 100
METRIC RATING
68th/ 347
METRIC RANK
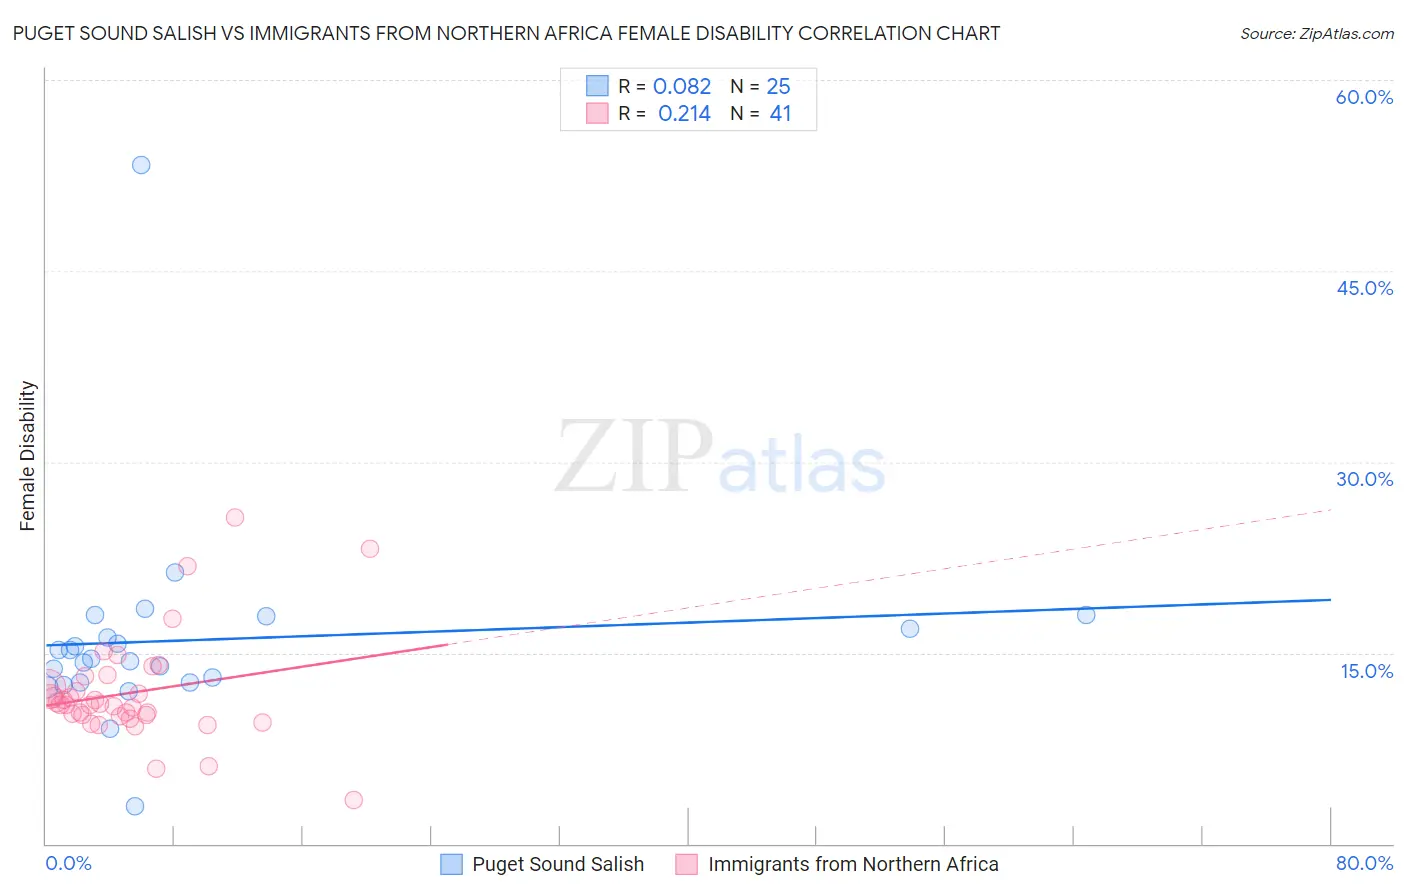
Puget Sound Salish vs Immigrants from Northern Africa Female Disability Correlation Chart
The statistical analysis conducted on geographies consisting of 46,152,398 people shows a slight positive correlation between the proportion of Puget Sound Salish and percentage of females with a disability in the United States with a correlation coefficient (R) of 0.082 and weighted average of 13.8%. Similarly, the statistical analysis conducted on geographies consisting of 321,175,054 people shows a weak positive correlation between the proportion of Immigrants from Northern Africa and percentage of females with a disability in the United States with a correlation coefficient (R) of 0.214 and weighted average of 11.5%, a difference of 20.7%.
Female Disability Correlation Summary
| Measurement | Puget Sound Salish | Immigrants from Northern Africa |
| Minimum | 2.9% | 3.5% |
| Maximum | 53.3% | 25.6% |
| Range | 50.4% | 22.1% |
| Mean | 16.0% | 11.8% |
| Median | 14.5% | 10.9% |
| Interquartile 25% (IQ1) | 12.6% | 10.0% |
| Interquartile 75% (IQ3) | 17.4% | 12.7% |
| Interquartile Range (IQR) | 4.7% | 2.7% |
| Standard Deviation (Sample) | 8.5% | 4.1% |
| Standard Deviation (Population) | 8.4% | 4.1% |
Similar Demographics by Female Disability
Demographics Similar to Puget Sound Salish by Female Disability
In terms of female disability, the demographic groups most similar to Puget Sound Salish are Blackfeet (13.8%, a difference of 0.10%), Delaware (13.8%, a difference of 0.42%), Alaskan Athabascan (13.9%, a difference of 0.59%), Hopi (13.7%, a difference of 0.73%), and Spanish American (14.0%, a difference of 0.95%).
| Demographics | Rating | Rank | Female Disability |
| Central American Indians | 0.0 /100 | #307 | Tragic 13.6% |
| Cree | 0.0 /100 | #308 | Tragic 13.7% |
| French American Indians | 0.0 /100 | #309 | Tragic 13.7% |
| Apache | 0.0 /100 | #310 | Tragic 13.7% |
| Hopi | 0.0 /100 | #311 | Tragic 13.7% |
| Delaware | 0.0 /100 | #312 | Tragic 13.8% |
| Blackfeet | 0.0 /100 | #313 | Tragic 13.8% |
| Puget Sound Salish | 0.0 /100 | #314 | Tragic 13.8% |
| Alaskan Athabascans | 0.0 /100 | #315 | Tragic 13.9% |
| Spanish Americans | 0.0 /100 | #316 | Tragic 14.0% |
| Chippewa | 0.0 /100 | #317 | Tragic 14.0% |
| Paiute | 0.0 /100 | #318 | Tragic 14.0% |
| Iroquois | 0.0 /100 | #319 | Tragic 14.0% |
| Americans | 0.0 /100 | #320 | Tragic 14.1% |
| Potawatomi | 0.0 /100 | #321 | Tragic 14.1% |
Demographics Similar to Immigrants from Northern Africa by Female Disability
In terms of female disability, the demographic groups most similar to Immigrants from Northern Africa are Immigrants from Vietnam (11.5%, a difference of 0.020%), Salvadoran (11.5%, a difference of 0.060%), Colombian (11.5%, a difference of 0.070%), Immigrants from Chile (11.5%, a difference of 0.080%), and Immigrants from Ireland (11.5%, a difference of 0.13%).
| Demographics | Rating | Rank | Female Disability |
| Immigrants | France | 99.9 /100 | #61 | Exceptional 11.4% |
| Sri Lankans | 99.9 /100 | #62 | Exceptional 11.4% |
| Immigrants | Colombia | 99.9 /100 | #63 | Exceptional 11.4% |
| Immigrants | El Salvador | 99.9 /100 | #64 | Exceptional 11.4% |
| Immigrants | South America | 99.9 /100 | #65 | Exceptional 11.4% |
| Salvadorans | 99.8 /100 | #66 | Exceptional 11.5% |
| Immigrants | Vietnam | 99.8 /100 | #67 | Exceptional 11.5% |
| Immigrants | Northern Africa | 99.8 /100 | #68 | Exceptional 11.5% |
| Colombians | 99.8 /100 | #69 | Exceptional 11.5% |
| Immigrants | Chile | 99.8 /100 | #70 | Exceptional 11.5% |
| Immigrants | Ireland | 99.8 /100 | #71 | Exceptional 11.5% |
| Chileans | 99.8 /100 | #72 | Exceptional 11.5% |
| Immigrants | Switzerland | 99.8 /100 | #73 | Exceptional 11.5% |
| Bhutanese | 99.8 /100 | #74 | Exceptional 11.5% |
| Immigrants | Lebanon | 99.7 /100 | #75 | Exceptional 11.5% |