Puget Sound Salish vs Scotch-Irish Female Disability
COMPARE
Puget Sound Salish
Scotch-Irish
Female Disability
Female Disability Comparison
Puget Sound Salish
Scotch-Irish
13.8%
FEMALE DISABILITY
0.0/ 100
METRIC RATING
314th/ 347
METRIC RANK
13.4%
FEMALE DISABILITY
0.0/ 100
METRIC RATING
302nd/ 347
METRIC RANK
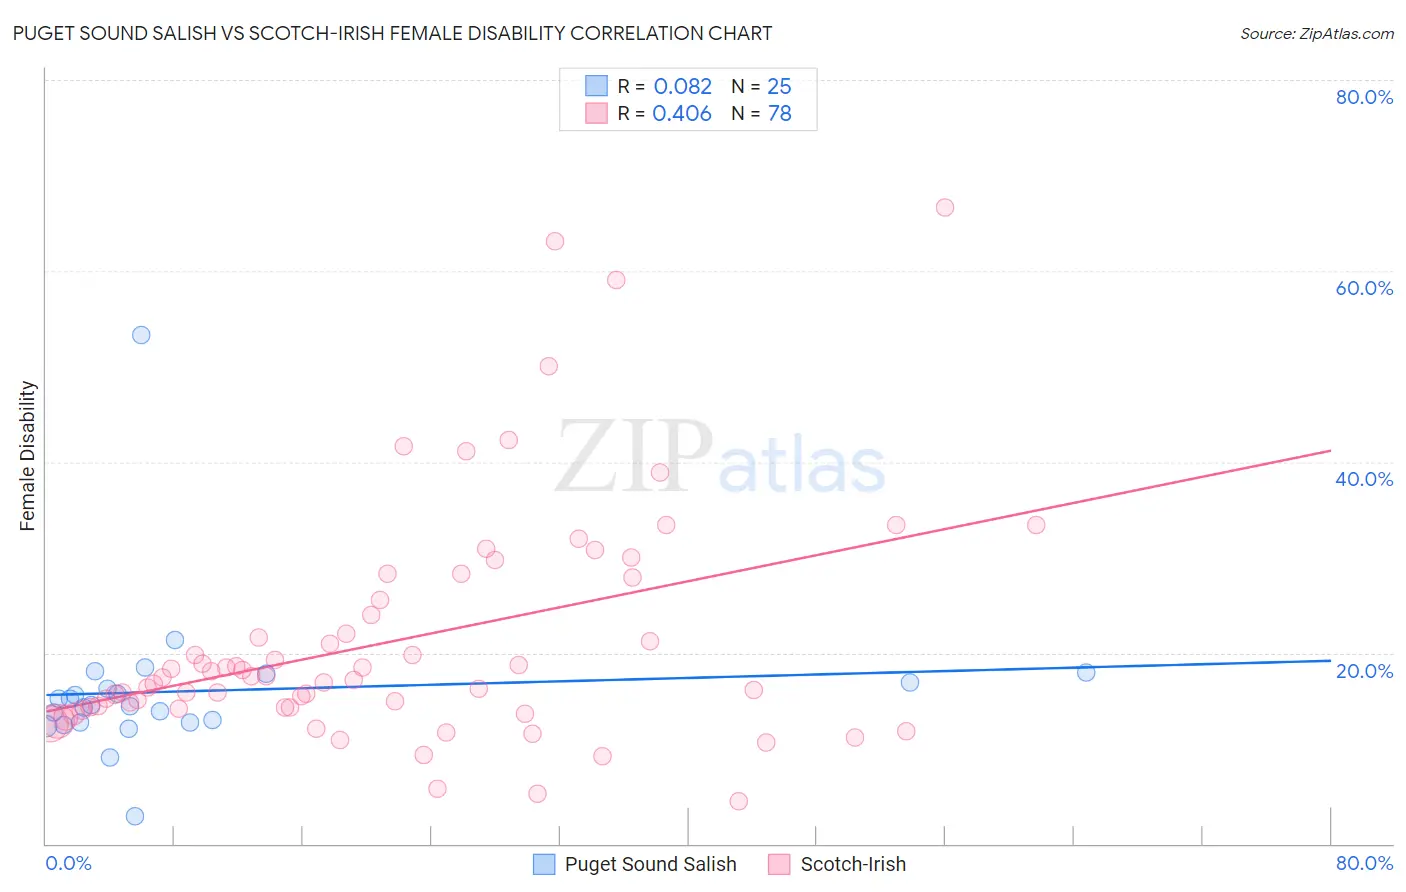
Puget Sound Salish vs Scotch-Irish Female Disability Correlation Chart
The statistical analysis conducted on geographies consisting of 46,152,398 people shows a slight positive correlation between the proportion of Puget Sound Salish and percentage of females with a disability in the United States with a correlation coefficient (R) of 0.082 and weighted average of 13.8%. Similarly, the statistical analysis conducted on geographies consisting of 548,573,243 people shows a moderate positive correlation between the proportion of Scotch-Irish and percentage of females with a disability in the United States with a correlation coefficient (R) of 0.406 and weighted average of 13.4%, a difference of 2.9%.
Female Disability Correlation Summary
| Measurement | Puget Sound Salish | Scotch-Irish |
| Minimum | 2.9% | 4.4% |
| Maximum | 53.3% | 66.7% |
| Range | 50.4% | 62.3% |
| Mean | 16.0% | 21.2% |
| Median | 14.5% | 17.3% |
| Interquartile 25% (IQ1) | 12.6% | 14.2% |
| Interquartile 75% (IQ3) | 17.4% | 25.5% |
| Interquartile Range (IQR) | 4.7% | 11.2% |
| Standard Deviation (Sample) | 8.5% | 12.3% |
| Standard Deviation (Population) | 8.4% | 12.2% |
Demographics Similar to Puget Sound Salish and Scotch-Irish by Female Disability
In terms of female disability, the demographic groups most similar to Puget Sound Salish are Blackfeet (13.8%, a difference of 0.10%), Delaware (13.8%, a difference of 0.42%), Alaskan Athabascan (13.9%, a difference of 0.59%), Hopi (13.7%, a difference of 0.73%), and Spanish American (14.0%, a difference of 0.95%). Similarly, the demographic groups most similar to Scotch-Irish are Immigrants from Portugal (13.5%, a difference of 0.0%), Immigrants from Micronesia (13.5%, a difference of 0.030%), African (13.4%, a difference of 0.14%), Pennsylvania German (13.4%, a difference of 0.34%), and Immigrants from Dominican Republic (13.4%, a difference of 0.35%).
| Demographics | Rating | Rank | Female Disability |
| Immigrants | Nonimmigrants | 0.0 /100 | #298 | Tragic 13.4% |
| Immigrants | Dominican Republic | 0.0 /100 | #299 | Tragic 13.4% |
| Pennsylvania Germans | 0.0 /100 | #300 | Tragic 13.4% |
| Africans | 0.0 /100 | #301 | Tragic 13.4% |
| Scotch-Irish | 0.0 /100 | #302 | Tragic 13.4% |
| Immigrants | Portugal | 0.0 /100 | #303 | Tragic 13.5% |
| Immigrants | Micronesia | 0.0 /100 | #304 | Tragic 13.5% |
| Dominicans | 0.0 /100 | #305 | Tragic 13.5% |
| French Canadians | 0.0 /100 | #306 | Tragic 13.6% |
| Central American Indians | 0.0 /100 | #307 | Tragic 13.6% |
| Cree | 0.0 /100 | #308 | Tragic 13.7% |
| French American Indians | 0.0 /100 | #309 | Tragic 13.7% |
| Apache | 0.0 /100 | #310 | Tragic 13.7% |
| Hopi | 0.0 /100 | #311 | Tragic 13.7% |
| Delaware | 0.0 /100 | #312 | Tragic 13.8% |
| Blackfeet | 0.0 /100 | #313 | Tragic 13.8% |
| Puget Sound Salish | 0.0 /100 | #314 | Tragic 13.8% |
| Alaskan Athabascans | 0.0 /100 | #315 | Tragic 13.9% |
| Spanish Americans | 0.0 /100 | #316 | Tragic 14.0% |
| Chippewa | 0.0 /100 | #317 | Tragic 14.0% |
| Paiute | 0.0 /100 | #318 | Tragic 14.0% |