Puget Sound Salish vs Italian Unemployment Among Ages 35 to 44 years
COMPARE
Puget Sound Salish
Italian
Unemployment Among Ages 35 to 44 years
Unemployment Among Ages 35 to 44 years Comparison
Puget Sound Salish
Italians
4.6%
UNEMPLOYMENT AMONG AGES 35 TO 44 YEARS
67.1/ 100
METRIC RATING
151st/ 347
METRIC RANK
4.5%
UNEMPLOYMENT AMONG AGES 35 TO 44 YEARS
91.9/ 100
METRIC RATING
100th/ 347
METRIC RANK
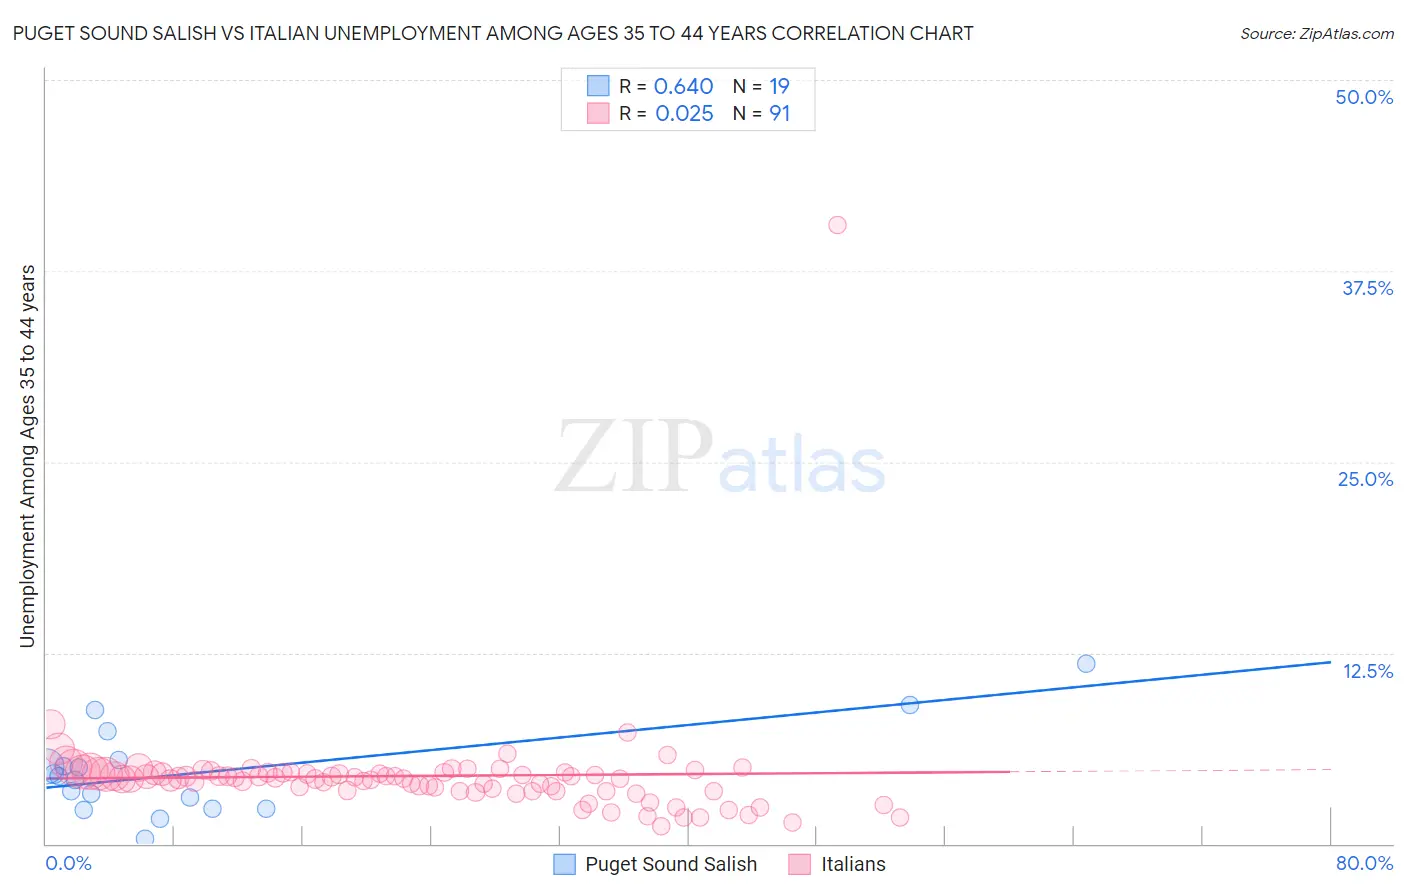
Puget Sound Salish vs Italian Unemployment Among Ages 35 to 44 years Correlation Chart
The statistical analysis conducted on geographies consisting of 45,742,187 people shows a significant positive correlation between the proportion of Puget Sound Salish and unemployment rate among population between the ages 35 and 44 in the United States with a correlation coefficient (R) of 0.640 and weighted average of 4.6%. Similarly, the statistical analysis conducted on geographies consisting of 534,997,275 people shows no correlation between the proportion of Italians and unemployment rate among population between the ages 35 and 44 in the United States with a correlation coefficient (R) of 0.025 and weighted average of 4.5%, a difference of 3.2%.
Unemployment Among Ages 35 to 44 years Correlation Summary
| Measurement | Puget Sound Salish | Italian |
| Minimum | 0.30% | 1.2% |
| Maximum | 11.8% | 40.5% |
| Range | 11.5% | 39.3% |
| Mean | 4.7% | 4.4% |
| Median | 4.4% | 4.3% |
| Interquartile 25% (IQ1) | 2.3% | 3.4% |
| Interquartile 75% (IQ3) | 5.5% | 4.7% |
| Interquartile Range (IQR) | 3.2% | 1.2% |
| Standard Deviation (Sample) | 2.9% | 4.0% |
| Standard Deviation (Population) | 2.8% | 4.0% |
Similar Demographics by Unemployment Among Ages 35 to 44 years
Demographics Similar to Puget Sound Salish by Unemployment Among Ages 35 to 44 years
In terms of unemployment among ages 35 to 44 years, the demographic groups most similar to Puget Sound Salish are Pakistani (4.6%, a difference of 0.0%), Immigrants from Brazil (4.6%, a difference of 0.010%), Immigrants from Western Europe (4.6%, a difference of 0.13%), White/Caucasian (4.6%, a difference of 0.18%), and South American (4.6%, a difference of 0.27%).
| Demographics | Rating | Rank | Unemployment Among Ages 35 to 44 years |
| Immigrants | Russia | 75.4 /100 | #144 | Good 4.6% |
| Immigrants | Eastern Europe | 74.7 /100 | #145 | Good 4.6% |
| Immigrants | Denmark | 74.4 /100 | #146 | Good 4.6% |
| Immigrants | Vietnam | 73.8 /100 | #147 | Good 4.6% |
| Slavs | 72.4 /100 | #148 | Good 4.6% |
| Immigrants | Burma/Myanmar | 72.2 /100 | #149 | Good 4.6% |
| Immigrants | England | 70.5 /100 | #150 | Good 4.6% |
| Puget Sound Salish | 67.1 /100 | #151 | Good 4.6% |
| Pakistanis | 67.1 /100 | #152 | Good 4.6% |
| Immigrants | Brazil | 67.0 /100 | #153 | Good 4.6% |
| Immigrants | Western Europe | 65.5 /100 | #154 | Good 4.6% |
| Whites/Caucasians | 64.9 /100 | #155 | Good 4.6% |
| South Americans | 63.7 /100 | #156 | Good 4.6% |
| Immigrants | Belarus | 63.4 /100 | #157 | Good 4.6% |
| Immigrants | Iran | 63.1 /100 | #158 | Good 4.6% |
Demographics Similar to Italians by Unemployment Among Ages 35 to 44 years
In terms of unemployment among ages 35 to 44 years, the demographic groups most similar to Italians are Immigrants from Netherlands (4.5%, a difference of 0.010%), Immigrants from Sudan (4.5%, a difference of 0.040%), Welsh (4.5%, a difference of 0.070%), Immigrants from Egypt (4.5%, a difference of 0.090%), and Finnish (4.5%, a difference of 0.090%).
| Demographics | Rating | Rank | Unemployment Among Ages 35 to 44 years |
| Iranians | 93.9 /100 | #93 | Exceptional 4.5% |
| Russians | 93.8 /100 | #94 | Exceptional 4.5% |
| Yugoslavians | 93.6 /100 | #95 | Exceptional 4.5% |
| Scottish | 93.5 /100 | #96 | Exceptional 4.5% |
| Immigrants | France | 92.5 /100 | #97 | Exceptional 4.5% |
| Immigrants | Canada | 92.3 /100 | #98 | Exceptional 4.5% |
| Immigrants | Egypt | 92.3 /100 | #99 | Exceptional 4.5% |
| Italians | 91.9 /100 | #100 | Exceptional 4.5% |
| Immigrants | Netherlands | 91.9 /100 | #101 | Exceptional 4.5% |
| Immigrants | Sudan | 91.8 /100 | #102 | Exceptional 4.5% |
| Welsh | 91.6 /100 | #103 | Exceptional 4.5% |
| Finns | 91.6 /100 | #104 | Exceptional 4.5% |
| Immigrants | Saudi Arabia | 91.3 /100 | #105 | Exceptional 4.5% |
| Immigrants | North America | 91.1 /100 | #106 | Exceptional 4.5% |
| Immigrants | North Macedonia | 90.7 /100 | #107 | Exceptional 4.5% |