Puget Sound Salish vs Immigrants from Armenia Female Disability
COMPARE
Puget Sound Salish
Immigrants from Armenia
Female Disability
Female Disability Comparison
Puget Sound Salish
Immigrants from Armenia
13.8%
FEMALE DISABILITY
0.0/ 100
METRIC RATING
314th/ 347
METRIC RANK
12.7%
FEMALE DISABILITY
1.0/ 100
METRIC RATING
259th/ 347
METRIC RANK
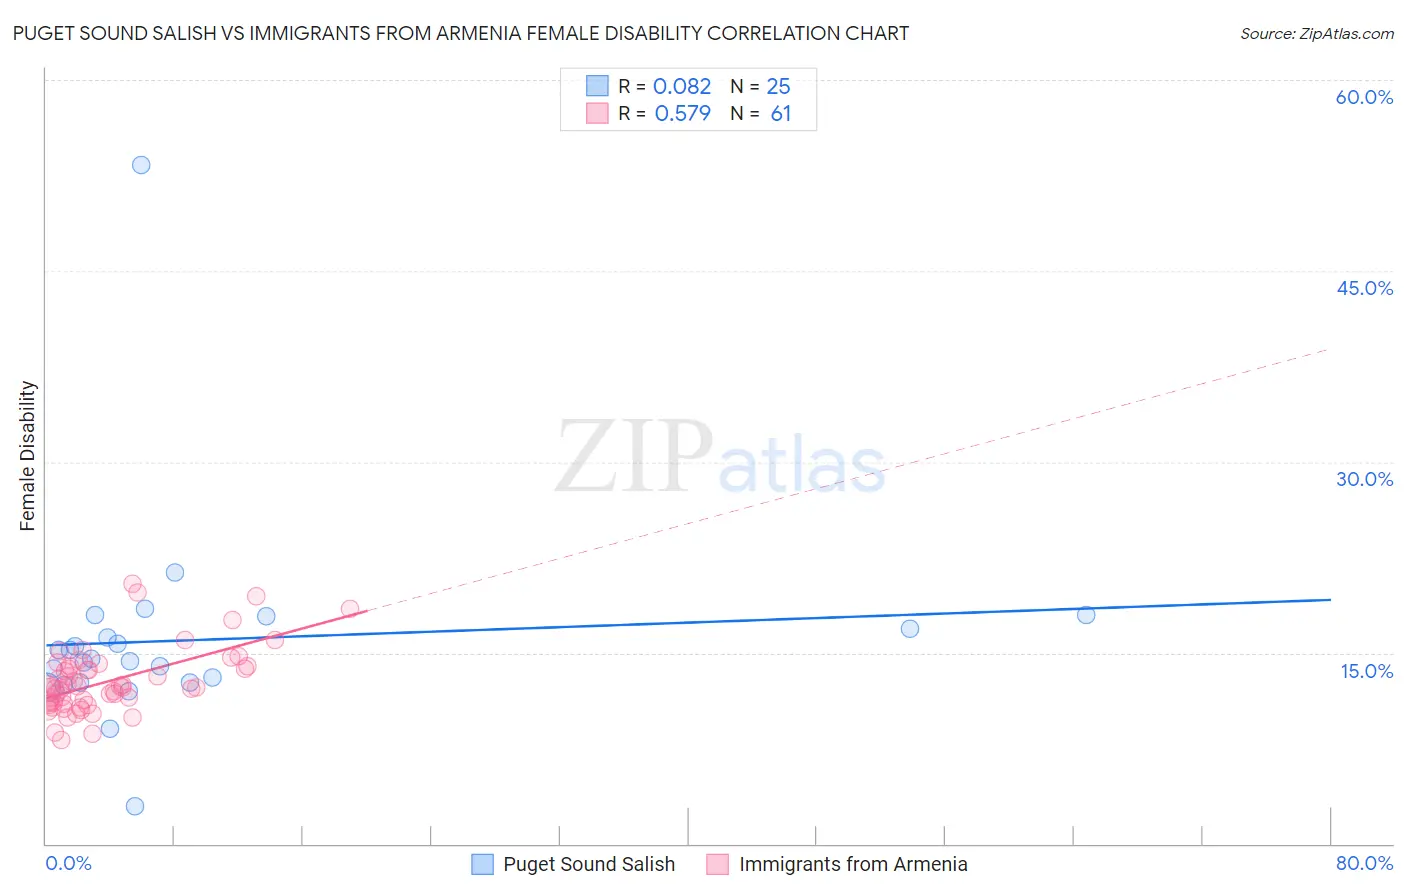
Puget Sound Salish vs Immigrants from Armenia Female Disability Correlation Chart
The statistical analysis conducted on geographies consisting of 46,152,398 people shows a slight positive correlation between the proportion of Puget Sound Salish and percentage of females with a disability in the United States with a correlation coefficient (R) of 0.082 and weighted average of 13.8%. Similarly, the statistical analysis conducted on geographies consisting of 97,707,143 people shows a substantial positive correlation between the proportion of Immigrants from Armenia and percentage of females with a disability in the United States with a correlation coefficient (R) of 0.579 and weighted average of 12.7%, a difference of 8.8%.
Female Disability Correlation Summary
| Measurement | Puget Sound Salish | Immigrants from Armenia |
| Minimum | 2.9% | 8.2% |
| Maximum | 53.3% | 20.4% |
| Range | 50.4% | 12.2% |
| Mean | 16.0% | 12.8% |
| Median | 14.5% | 12.3% |
| Interquartile 25% (IQ1) | 12.6% | 11.0% |
| Interquartile 75% (IQ3) | 17.4% | 13.9% |
| Interquartile Range (IQR) | 4.7% | 2.9% |
| Standard Deviation (Sample) | 8.5% | 2.6% |
| Standard Deviation (Population) | 8.4% | 2.6% |
Similar Demographics by Female Disability
Demographics Similar to Puget Sound Salish by Female Disability
In terms of female disability, the demographic groups most similar to Puget Sound Salish are Blackfeet (13.8%, a difference of 0.10%), Delaware (13.8%, a difference of 0.42%), Alaskan Athabascan (13.9%, a difference of 0.59%), Hopi (13.7%, a difference of 0.73%), and Spanish American (14.0%, a difference of 0.95%).
| Demographics | Rating | Rank | Female Disability |
| Central American Indians | 0.0 /100 | #307 | Tragic 13.6% |
| Cree | 0.0 /100 | #308 | Tragic 13.7% |
| French American Indians | 0.0 /100 | #309 | Tragic 13.7% |
| Apache | 0.0 /100 | #310 | Tragic 13.7% |
| Hopi | 0.0 /100 | #311 | Tragic 13.7% |
| Delaware | 0.0 /100 | #312 | Tragic 13.8% |
| Blackfeet | 0.0 /100 | #313 | Tragic 13.8% |
| Puget Sound Salish | 0.0 /100 | #314 | Tragic 13.8% |
| Alaskan Athabascans | 0.0 /100 | #315 | Tragic 13.9% |
| Spanish Americans | 0.0 /100 | #316 | Tragic 14.0% |
| Chippewa | 0.0 /100 | #317 | Tragic 14.0% |
| Paiute | 0.0 /100 | #318 | Tragic 14.0% |
| Iroquois | 0.0 /100 | #319 | Tragic 14.0% |
| Americans | 0.0 /100 | #320 | Tragic 14.1% |
| Potawatomi | 0.0 /100 | #321 | Tragic 14.1% |
Demographics Similar to Immigrants from Armenia by Female Disability
In terms of female disability, the demographic groups most similar to Immigrants from Armenia are Subsaharan African (12.7%, a difference of 0.010%), Bermudan (12.7%, a difference of 0.050%), Liberian (12.7%, a difference of 0.080%), Aleut (12.7%, a difference of 0.080%), and British West Indian (12.7%, a difference of 0.11%).
| Demographics | Rating | Rank | Female Disability |
| Immigrants | Caribbean | 1.4 /100 | #252 | Tragic 12.7% |
| Jamaicans | 1.4 /100 | #253 | Tragic 12.7% |
| Hawaiians | 1.4 /100 | #254 | Tragic 12.7% |
| Immigrants | Germany | 1.3 /100 | #255 | Tragic 12.7% |
| British West Indians | 1.2 /100 | #256 | Tragic 12.7% |
| Liberians | 1.1 /100 | #257 | Tragic 12.7% |
| Aleuts | 1.1 /100 | #258 | Tragic 12.7% |
| Immigrants | Armenia | 1.0 /100 | #259 | Tragic 12.7% |
| Sub-Saharan Africans | 1.0 /100 | #260 | Tragic 12.7% |
| Bermudans | 1.0 /100 | #261 | Tragic 12.7% |
| Czechoslovakians | 0.9 /100 | #262 | Tragic 12.7% |
| Spaniards | 0.7 /100 | #263 | Tragic 12.8% |
| Alaska Natives | 0.6 /100 | #264 | Tragic 12.8% |
| West Indians | 0.5 /100 | #265 | Tragic 12.8% |
| Finns | 0.4 /100 | #266 | Tragic 12.8% |