Puget Sound Salish vs Haitian Female Disability
COMPARE
Puget Sound Salish
Haitian
Female Disability
Female Disability Comparison
Puget Sound Salish
Haitians
13.8%
FEMALE DISABILITY
0.0/ 100
METRIC RATING
314th/ 347
METRIC RANK
12.2%
FEMALE DISABILITY
51.9/ 100
METRIC RATING
172nd/ 347
METRIC RANK
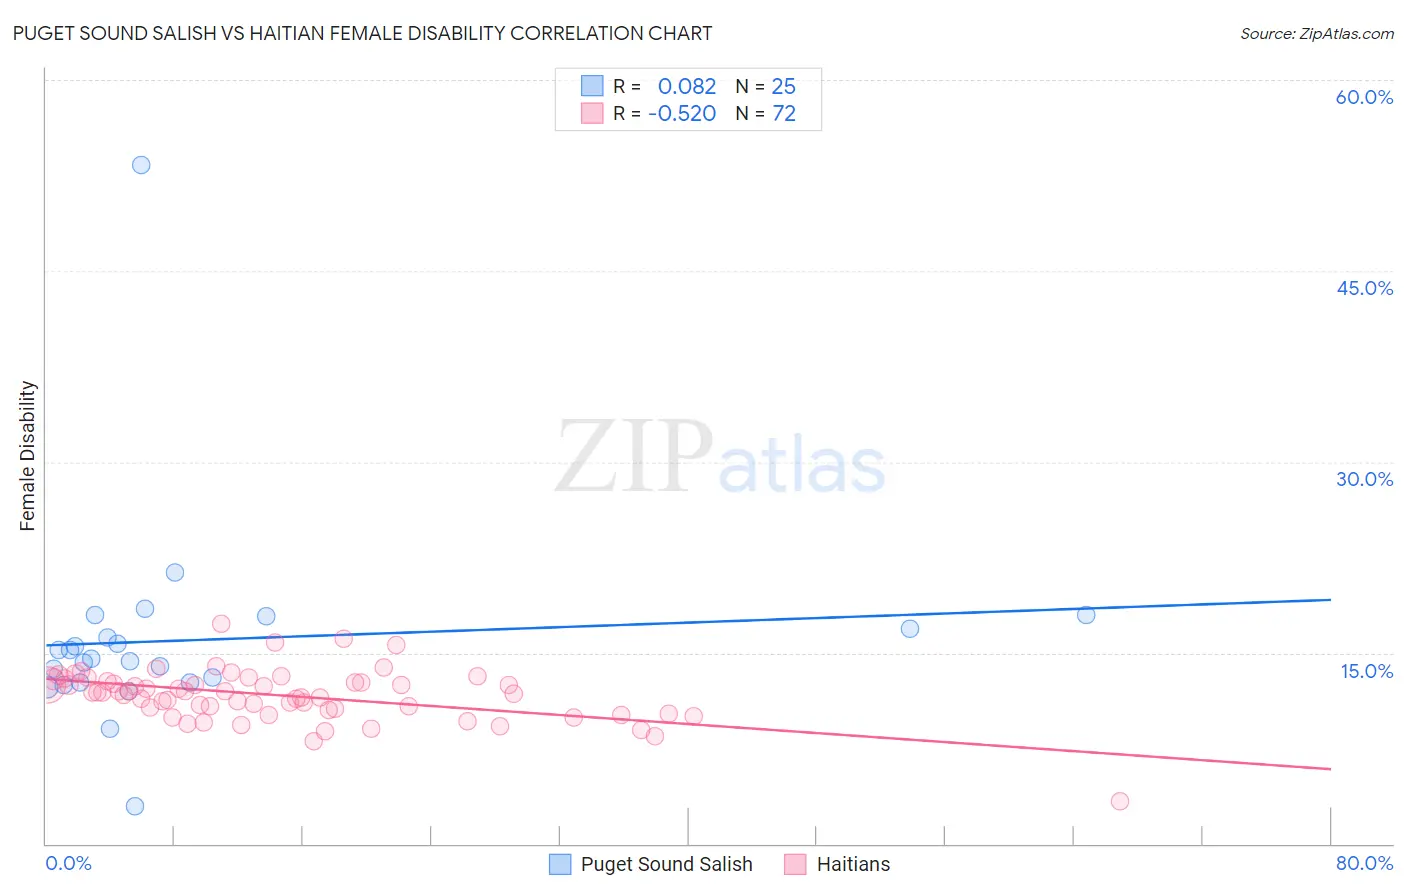
Puget Sound Salish vs Haitian Female Disability Correlation Chart
The statistical analysis conducted on geographies consisting of 46,152,398 people shows a slight positive correlation between the proportion of Puget Sound Salish and percentage of females with a disability in the United States with a correlation coefficient (R) of 0.082 and weighted average of 13.8%. Similarly, the statistical analysis conducted on geographies consisting of 287,924,181 people shows a substantial negative correlation between the proportion of Haitians and percentage of females with a disability in the United States with a correlation coefficient (R) of -0.520 and weighted average of 12.2%, a difference of 13.6%.
Female Disability Correlation Summary
| Measurement | Puget Sound Salish | Haitian |
| Minimum | 2.9% | 3.3% |
| Maximum | 53.3% | 17.2% |
| Range | 50.4% | 13.9% |
| Mean | 16.0% | 11.6% |
| Median | 14.5% | 11.9% |
| Interquartile 25% (IQ1) | 12.6% | 10.5% |
| Interquartile 75% (IQ3) | 17.4% | 12.7% |
| Interquartile Range (IQR) | 4.7% | 2.2% |
| Standard Deviation (Sample) | 8.5% | 2.0% |
| Standard Deviation (Population) | 8.4% | 2.0% |
Similar Demographics by Female Disability
Demographics Similar to Puget Sound Salish by Female Disability
In terms of female disability, the demographic groups most similar to Puget Sound Salish are Blackfeet (13.8%, a difference of 0.10%), Delaware (13.8%, a difference of 0.42%), Alaskan Athabascan (13.9%, a difference of 0.59%), Hopi (13.7%, a difference of 0.73%), and Spanish American (14.0%, a difference of 0.95%).
| Demographics | Rating | Rank | Female Disability |
| Central American Indians | 0.0 /100 | #307 | Tragic 13.6% |
| Cree | 0.0 /100 | #308 | Tragic 13.7% |
| French American Indians | 0.0 /100 | #309 | Tragic 13.7% |
| Apache | 0.0 /100 | #310 | Tragic 13.7% |
| Hopi | 0.0 /100 | #311 | Tragic 13.7% |
| Delaware | 0.0 /100 | #312 | Tragic 13.8% |
| Blackfeet | 0.0 /100 | #313 | Tragic 13.8% |
| Puget Sound Salish | 0.0 /100 | #314 | Tragic 13.8% |
| Alaskan Athabascans | 0.0 /100 | #315 | Tragic 13.9% |
| Spanish Americans | 0.0 /100 | #316 | Tragic 14.0% |
| Chippewa | 0.0 /100 | #317 | Tragic 14.0% |
| Paiute | 0.0 /100 | #318 | Tragic 14.0% |
| Iroquois | 0.0 /100 | #319 | Tragic 14.0% |
| Americans | 0.0 /100 | #320 | Tragic 14.1% |
| Potawatomi | 0.0 /100 | #321 | Tragic 14.1% |
Demographics Similar to Haitians by Female Disability
In terms of female disability, the demographic groups most similar to Haitians are Immigrants from Mexico (12.2%, a difference of 0.040%), Immigrants from England (12.2%, a difference of 0.070%), Immigrants from St. Vincent and the Grenadines (12.2%, a difference of 0.080%), Immigrants from Southern Europe (12.2%, a difference of 0.17%), and Maltese (12.2%, a difference of 0.19%).
| Demographics | Rating | Rank | Female Disability |
| Immigrants | Oceania | 61.8 /100 | #165 | Good 12.1% |
| Lithuanians | 59.5 /100 | #166 | Average 12.2% |
| Immigrants | Latin America | 59.0 /100 | #167 | Average 12.2% |
| Immigrants | Haiti | 58.8 /100 | #168 | Average 12.2% |
| Lebanese | 58.1 /100 | #169 | Average 12.2% |
| Maltese | 57.0 /100 | #170 | Average 12.2% |
| Immigrants | Southern Europe | 56.3 /100 | #171 | Average 12.2% |
| Haitians | 51.9 /100 | #172 | Average 12.2% |
| Immigrants | Mexico | 50.8 /100 | #173 | Average 12.2% |
| Immigrants | England | 50.0 /100 | #174 | Average 12.2% |
| Immigrants | St. Vincent and the Grenadines | 49.7 /100 | #175 | Average 12.2% |
| Immigrants | Guyana | 43.1 /100 | #176 | Average 12.2% |
| Immigrants | Ghana | 42.5 /100 | #177 | Average 12.2% |
| Immigrants | Western Europe | 40.9 /100 | #178 | Average 12.2% |
| Immigrants | Fiji | 38.2 /100 | #179 | Fair 12.3% |