Puget Sound Salish vs Italian College, 1 year or more
COMPARE
Puget Sound Salish
Italian
College, 1 year or more
College, 1 year or more Comparison
Puget Sound Salish
Italians
55.9%
COLLEGE, 1 YEAR OR MORE
1.1/ 100
METRIC RATING
239th/ 347
METRIC RANK
61.1%
COLLEGE, 1 YEAR OR MORE
89.5/ 100
METRIC RATING
130th/ 347
METRIC RANK
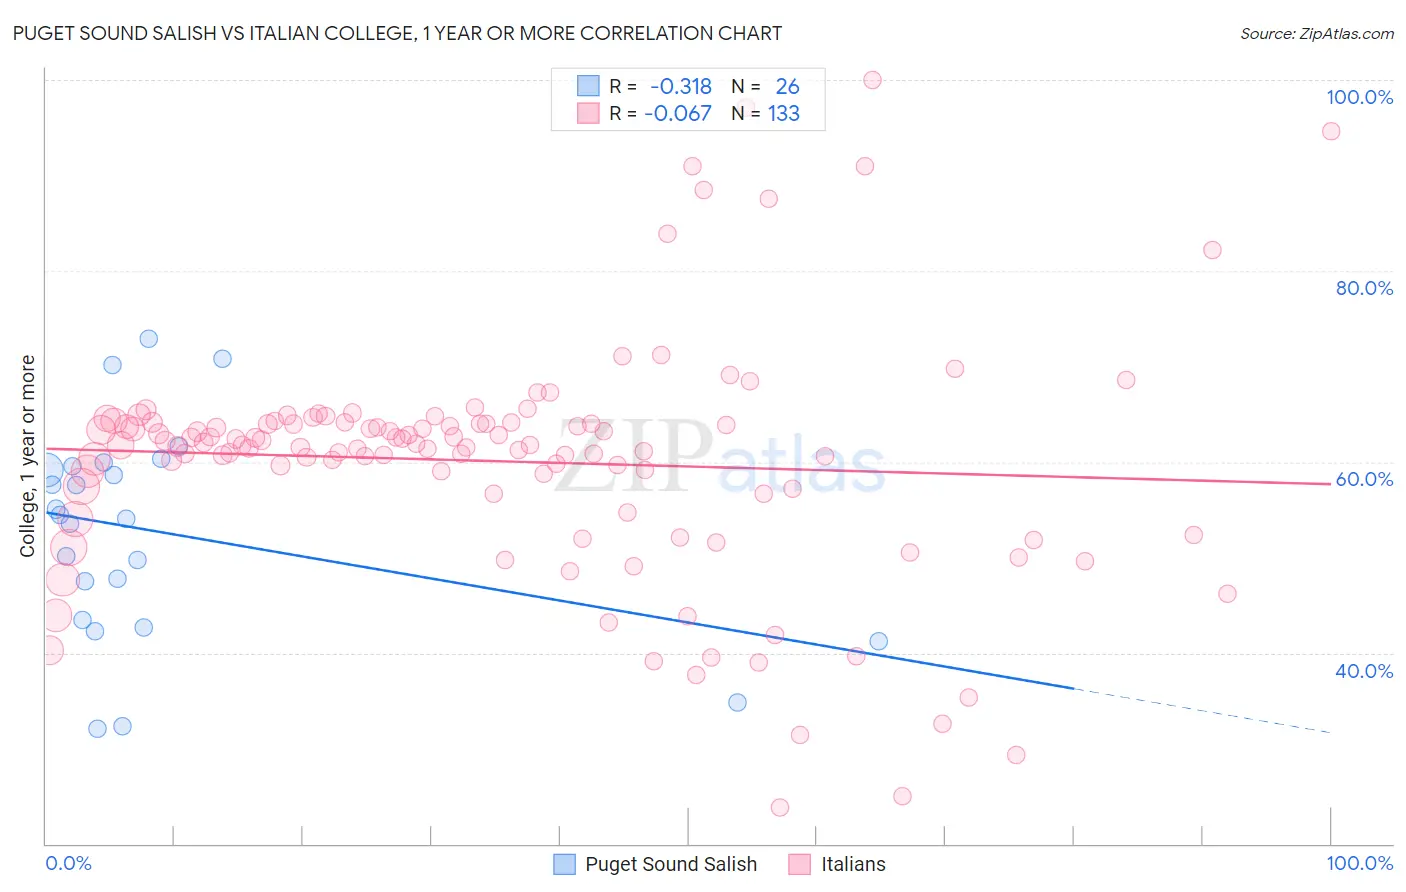
Puget Sound Salish vs Italian College, 1 year or more Correlation Chart
The statistical analysis conducted on geographies consisting of 46,155,865 people shows a mild negative correlation between the proportion of Puget Sound Salish and percentage of population with at least college, 1 year or more education in the United States with a correlation coefficient (R) of -0.318 and weighted average of 55.9%. Similarly, the statistical analysis conducted on geographies consisting of 575,103,954 people shows a slight negative correlation between the proportion of Italians and percentage of population with at least college, 1 year or more education in the United States with a correlation coefficient (R) of -0.067 and weighted average of 61.1%, a difference of 9.3%.
College, 1 year or more Correlation Summary
| Measurement | Puget Sound Salish | Italian |
| Minimum | 32.1% | 23.8% |
| Maximum | 72.9% | 100.0% |
| Range | 40.8% | 76.2% |
| Mean | 52.7% | 60.1% |
| Median | 54.3% | 61.8% |
| Interquartile 25% (IQ1) | 43.4% | 56.6% |
| Interquartile 75% (IQ3) | 59.6% | 64.0% |
| Interquartile Range (IQR) | 16.2% | 7.4% |
| Standard Deviation (Sample) | 11.1% | 12.6% |
| Standard Deviation (Population) | 10.9% | 12.6% |
Similar Demographics by College, 1 year or more
Demographics Similar to Puget Sound Salish by College, 1 year or more
In terms of college, 1 year or more, the demographic groups most similar to Puget Sound Salish are Trinidadian and Tobagonian (55.8%, a difference of 0.090%), French American Indian (55.8%, a difference of 0.14%), Barbadian (56.0%, a difference of 0.20%), Marshallese (55.8%, a difference of 0.25%), and Osage (55.8%, a difference of 0.26%).
| Demographics | Rating | Rank | College, 1 year or more |
| Immigrants | Bangladesh | 2.6 /100 | #232 | Tragic 56.6% |
| Immigrants | Nonimmigrants | 2.5 /100 | #233 | Tragic 56.5% |
| Spanish Americans | 1.8 /100 | #234 | Tragic 56.3% |
| West Indians | 1.8 /100 | #235 | Tragic 56.3% |
| Iroquois | 1.7 /100 | #236 | Tragic 56.2% |
| Samoans | 1.6 /100 | #237 | Tragic 56.2% |
| Barbadians | 1.3 /100 | #238 | Tragic 56.0% |
| Puget Sound Salish | 1.1 /100 | #239 | Tragic 55.9% |
| Trinidadians and Tobagonians | 1.1 /100 | #240 | Tragic 55.8% |
| French American Indians | 1.0 /100 | #241 | Tragic 55.8% |
| Marshallese | 1.0 /100 | #242 | Tragic 55.8% |
| Osage | 1.0 /100 | #243 | Tragic 55.8% |
| Chippewa | 0.9 /100 | #244 | Tragic 55.7% |
| Immigrants | Liberia | 0.8 /100 | #245 | Tragic 55.7% |
| Malaysians | 0.8 /100 | #246 | Tragic 55.6% |
Demographics Similar to Italians by College, 1 year or more
In terms of college, 1 year or more, the demographic groups most similar to Italians are Immigrants from Morocco (61.1%, a difference of 0.0%), Scandinavian (61.0%, a difference of 0.17%), Ugandan (61.2%, a difference of 0.18%), Immigrants from Uzbekistan (61.0%, a difference of 0.20%), and Immigrants from Venezuela (61.0%, a difference of 0.21%).
| Demographics | Rating | Rank | College, 1 year or more |
| Serbians | 92.2 /100 | #123 | Exceptional 61.4% |
| Venezuelans | 92.1 /100 | #124 | Exceptional 61.3% |
| Immigrants | Syria | 91.6 /100 | #125 | Exceptional 61.3% |
| Alsatians | 91.3 /100 | #126 | Exceptional 61.3% |
| Immigrants | Eastern Africa | 91.1 /100 | #127 | Exceptional 61.2% |
| Immigrants | Italy | 91.1 /100 | #128 | Exceptional 61.2% |
| Ugandans | 90.7 /100 | #129 | Exceptional 61.2% |
| Italians | 89.5 /100 | #130 | Excellent 61.1% |
| Immigrants | Morocco | 89.5 /100 | #131 | Excellent 61.1% |
| Scandinavians | 88.2 /100 | #132 | Excellent 61.0% |
| Immigrants | Uzbekistan | 88.0 /100 | #133 | Excellent 61.0% |
| Immigrants | Venezuela | 87.9 /100 | #134 | Excellent 61.0% |
| Immigrants | Uganda | 87.4 /100 | #135 | Excellent 60.9% |
| Basques | 87.2 /100 | #136 | Excellent 60.9% |
| Slovenes | 86.5 /100 | #137 | Excellent 60.9% |