Marshallese vs Italian Female Disability
COMPARE
Marshallese
Italian
Female Disability
Female Disability Comparison
Marshallese
Italians
13.3%
FEMALE DISABILITY
0.0/ 100
METRIC RATING
293rd/ 347
METRIC RANK
12.4%
FEMALE DISABILITY
10.7/ 100
METRIC RATING
222nd/ 347
METRIC RANK
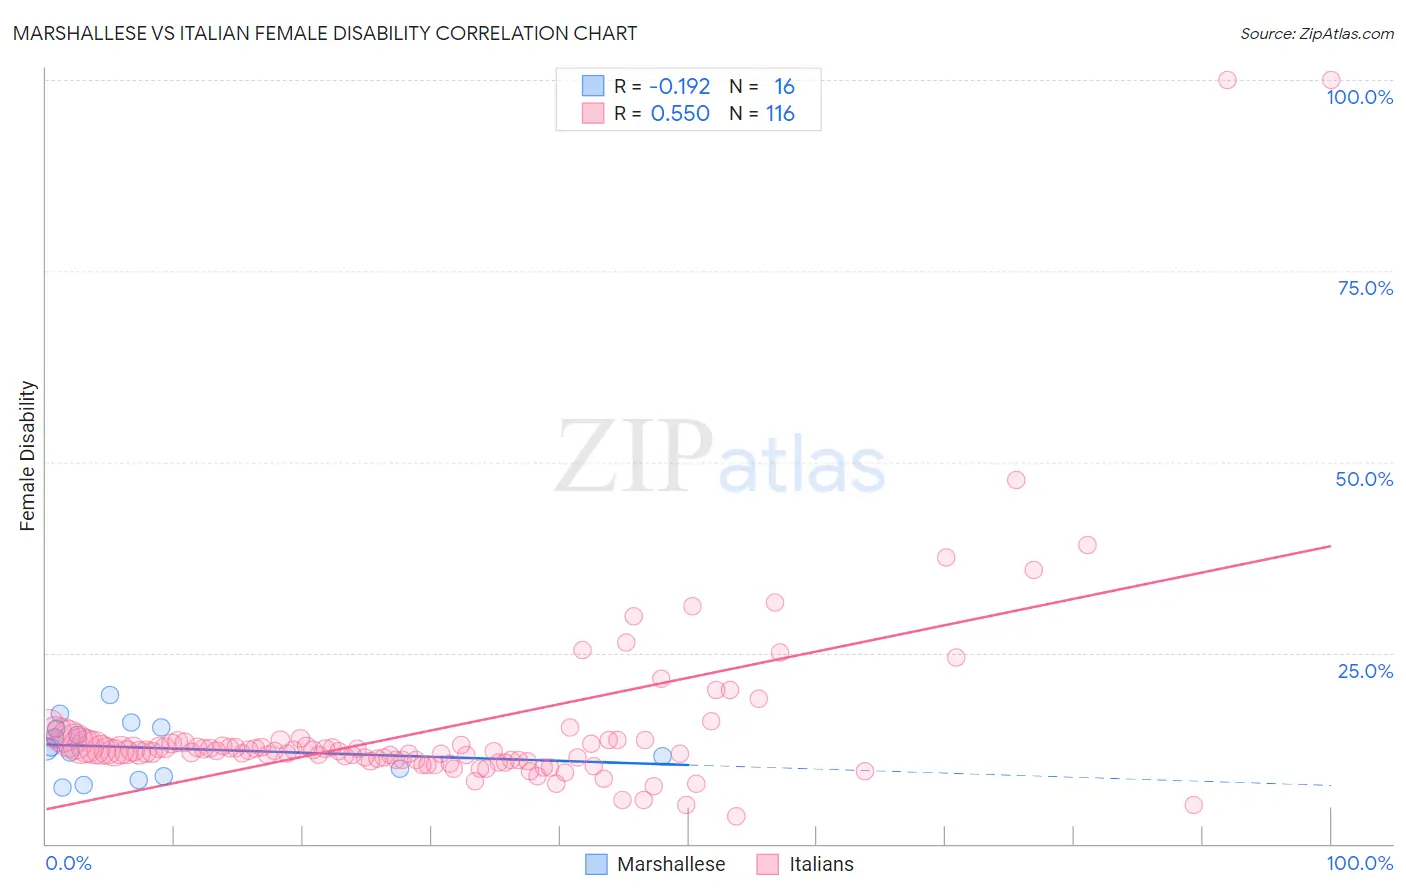
Marshallese vs Italian Female Disability Correlation Chart
The statistical analysis conducted on geographies consisting of 14,761,315 people shows a poor negative correlation between the proportion of Marshallese and percentage of females with a disability in the United States with a correlation coefficient (R) of -0.192 and weighted average of 13.3%. Similarly, the statistical analysis conducted on geographies consisting of 574,730,286 people shows a substantial positive correlation between the proportion of Italians and percentage of females with a disability in the United States with a correlation coefficient (R) of 0.550 and weighted average of 12.4%, a difference of 6.7%.
Female Disability Correlation Summary
| Measurement | Marshallese | Italian |
| Minimum | 7.4% | 3.6% |
| Maximum | 19.5% | 100.0% |
| Range | 12.1% | 96.4% |
| Mean | 12.6% | 15.2% |
| Median | 12.5% | 12.2% |
| Interquartile 25% (IQ1) | 9.3% | 11.0% |
| Interquartile 75% (IQ3) | 15.1% | 13.4% |
| Interquartile Range (IQR) | 5.8% | 2.4% |
| Standard Deviation (Sample) | 3.5% | 13.2% |
| Standard Deviation (Population) | 3.4% | 13.1% |
Similar Demographics by Female Disability
Demographics Similar to Marshallese by Female Disability
In terms of female disability, the demographic groups most similar to Marshallese are Celtic (13.3%, a difference of 0.050%), Yakama (13.2%, a difference of 0.26%), French (13.3%, a difference of 0.26%), Nepalese (13.3%, a difference of 0.39%), and Slovak (13.3%, a difference of 0.42%).
| Demographics | Rating | Rank | Female Disability |
| Fijians | 0.0 /100 | #286 | Tragic 13.1% |
| Yaqui | 0.0 /100 | #287 | Tragic 13.2% |
| Whites/Caucasians | 0.0 /100 | #288 | Tragic 13.2% |
| Tlingit-Haida | 0.0 /100 | #289 | Tragic 13.2% |
| Immigrants | Yemen | 0.0 /100 | #290 | Tragic 13.2% |
| Shoshone | 0.0 /100 | #291 | Tragic 13.2% |
| Yakama | 0.0 /100 | #292 | Tragic 13.2% |
| Marshallese | 0.0 /100 | #293 | Tragic 13.3% |
| Celtics | 0.0 /100 | #294 | Tragic 13.3% |
| French | 0.0 /100 | #295 | Tragic 13.3% |
| Nepalese | 0.0 /100 | #296 | Tragic 13.3% |
| Slovaks | 0.0 /100 | #297 | Tragic 13.3% |
| Immigrants | Nonimmigrants | 0.0 /100 | #298 | Tragic 13.4% |
| Immigrants | Dominican Republic | 0.0 /100 | #299 | Tragic 13.4% |
| Pennsylvania Germans | 0.0 /100 | #300 | Tragic 13.4% |
Demographics Similar to Italians by Female Disability
In terms of female disability, the demographic groups most similar to Italians are Native Hawaiian (12.4%, a difference of 0.010%), Bahamian (12.4%, a difference of 0.040%), European (12.4%, a difference of 0.13%), Guamanian/Chamorro (12.5%, a difference of 0.13%), and Belizean (12.5%, a difference of 0.14%).
| Demographics | Rating | Rank | Female Disability |
| Samoans | 13.4 /100 | #215 | Poor 12.4% |
| Immigrants | Burma/Myanmar | 13.3 /100 | #216 | Poor 12.4% |
| British | 12.7 /100 | #217 | Poor 12.4% |
| Immigrants | Bahamas | 12.5 /100 | #218 | Poor 12.4% |
| Europeans | 12.1 /100 | #219 | Poor 12.4% |
| Bahamians | 11.1 /100 | #220 | Poor 12.4% |
| Native Hawaiians | 10.8 /100 | #221 | Poor 12.4% |
| Italians | 10.7 /100 | #222 | Poor 12.4% |
| Guamanians/Chamorros | 9.5 /100 | #223 | Tragic 12.5% |
| Belizeans | 9.3 /100 | #224 | Tragic 12.5% |
| Poles | 8.4 /100 | #225 | Tragic 12.5% |
| Hispanics or Latinos | 8.0 /100 | #226 | Tragic 12.5% |
| Assyrians/Chaldeans/Syriacs | 8.0 /100 | #227 | Tragic 12.5% |
| Immigrants | Cambodia | 7.8 /100 | #228 | Tragic 12.5% |
| Hungarians | 7.2 /100 | #229 | Tragic 12.5% |