Cheyenne vs Icelander Female Disability

COMPARE

Cheyenne
Race
Ancestry
AfghanAfricanAlaska NativeAlaskan AthabascanAlbanianAleutAlsatianAmericanApacheArabArapahoArgentineanArmenianAssyrian/Chaldean/SyriacAustralianAustrianBahamianBangladeshiBarbadianBasqueBelgianBelizeanBermudanBhutaneseBlackfeetBolivianBrazilianBritishBritish West IndianBulgarianBurmeseCajunCambodianCanadianCape VerdeanCarpatho RusynCelticCentral AmericanCentral American IndianCherokeeCheyenneChickasawChileanChineseChippewaChoctawColombianColvilleComancheCosta RicanCreeCreekCroatianCrowCubanCypriotCzechCzechoslovakianDanishDelawareDominicanDutchDutch West IndianEastern EuropeanEcuadorianEgyptianEnglishEstonianEthiopianEuropeanFijianFilipinoFinnishFrenchFrench American IndianFrench CanadianGermanGerman RussianGhanaianGreekGuamanian/ChamorroGuatemalanGuyaneseHaitianHmongHonduranHopiHoumaHungarianIndian (Asian)IndonesianInupiatIranianIraqiIrishIroquoisIsraeliItalianJamaicanJapaneseJordanianKenyanKiowaKoreanLaotianLatvianLebaneseLiberianLithuanianLumbeeLuxembourgerMacedonianMalaysianMalteseMarshalleseMenomineeMexicanMexican American IndianMongolianMoroccanNative HawaiianNavajoNepaleseNew ZealanderNicaraguanNigerianNorthern EuropeanNorwegianOkinawanOsageOttawaPaiutePakistaniPalestinianPanamanianParaguayanPennsylvania GermanPeruvianPimaPolishPortuguesePotawatomiPuebloPuerto RicanPuget Sound SalishRomanianRussianSalvadoranSamoanScandinavianScotch-IrishScottishSeminoleSenegaleseSerbianShoshoneSierra LeoneanSiouxSlavicSlovakSloveneSomaliSouth AfricanSouth AmericanSouth American IndianSoviet UnionSpaniardSpanishSpanish AmericanSpanish American IndianSri LankanSubsaharan AfricanSudaneseSwedishSwissSyrianTaiwaneseThaiTlingit-HaidaTohono O'OdhamTonganTrinidadian and TobagonianTsimshianTurkishU.S. Virgin IslanderUgandanUkrainianUruguayanUteVenezuelanVietnameseWelshWest IndianYakamaYaquiYugoslavianYumanYup'ikZimbabwean
Immigration
NonimmigrantsImmigrantsAfghanistanAfricaAlbaniaArgentinaArmeniaAsiaAustraliaAustriaBahamasBangladeshBarbadosBelarusBelgiumBelizeBoliviaBosnia and HerzegovinaBrazilBulgariaBurma/MyanmarCabo VerdeCambodiaCameroonCanadaCaribbeanCentral AmericaChileChinaColombiaCongoCosta RicaCroatiaCubaCzechoslovakiaDenmarkDominicaDominican RepublicEastern AfricaEastern AsiaEastern EuropeEcuadorEgyptEl SalvadorEnglandEritreaEthiopiaEuropeFijiFranceGermanyGhanaGreeceGrenadaGuatemalaGuyanaHaitiHondurasHong KongHungaryIndiaIndonesiaIranIraqIrelandIsraelItalyJamaicaJapanJordanKazakhstanKenyaKoreaKuwaitLaosLatin AmericaLatviaLebanonLiberiaLithuaniaMalaysiaMexicoMicronesiaMiddle AfricaMoldovaMoroccoNepalNetherlandsNicaraguaNigeriaNorth AmericaNorth MacedoniaNorthern AfricaNorthern EuropeNorwayOceaniaPakistanPanamaPeruPhilippinesPolandPortugalRomaniaRussiaSaudi ArabiaScotlandSenegalSerbiaSierra LeoneSingaporeSomaliaSouth AfricaSouth AmericaSouth Central AsiaSouth Eastern AsiaSouthern EuropeSpainSri LankaSt. Vincent and the GrenadinesSudanSwedenSwitzerlandSyriaTaiwanThailandTrinidad and TobagoTurkeyUgandaUkraineUruguayUzbekistanVenezuelaVietnamWest IndiesWestern AfricaWestern AsiaWestern EuropeYemenZaireZimbabweAzores
Icelander
Race
Ancestry
AfghanAfricanAlaska NativeAlaskan AthabascanAlbanianAleutAlsatianAmericanApacheArabArapahoArgentineanArmenianAssyrian/Chaldean/SyriacAustralianAustrianBahamianBangladeshiBarbadianBasqueBelgianBelizeanBermudanBhutaneseBlackfeetBolivianBrazilianBritishBritish West IndianBulgarianBurmeseCajunCambodianCanadianCape VerdeanCarpatho RusynCelticCentral AmericanCentral American IndianCherokeeChickasawChileanChineseChippewaChoctawColombianColvilleComancheCosta RicanCreeCreekCroatianCrowCubanCypriotCzechCzechoslovakianDanishDelawareDominicanDutchDutch West IndianEastern EuropeanEcuadorianEgyptianEnglishEstonianEthiopianEuropeanFijianFilipinoFinnishFrenchFrench American IndianFrench CanadianGermanGerman RussianGhanaianGreekGuamanian/ChamorroGuatemalanGuyaneseHaitianHmongHonduranHopiHoumaHungarianIcelanderIndian (Asian)IndonesianInupiatIranianIraqiIrishIroquoisIsraeliItalianJamaicanJapaneseJordanianKenyanKiowaKoreanLaotianLatvianLebaneseLiberianLithuanianLumbeeLuxembourgerMacedonianMalaysianMalteseMarshalleseMenomineeMexicanMexican American IndianMongolianMoroccanNative HawaiianNavajoNepaleseNew ZealanderNicaraguanNigerianNorthern EuropeanNorwegianOkinawanOsageOttawaPaiutePakistaniPalestinianPanamanianParaguayanPennsylvania GermanPeruvianPimaPolishPortuguesePotawatomiPuebloPuerto RicanPuget Sound SalishRomanianRussianSalvadoranSamoanScandinavianScotch-IrishScottishSeminoleSenegaleseSerbianShoshoneSierra LeoneanSiouxSlavicSlovakSloveneSomaliSouth AfricanSouth AmericanSouth American IndianSoviet UnionSpaniardSpanishSpanish AmericanSpanish American IndianSri LankanSubsaharan AfricanSudaneseSwedishSwissSyrianTaiwaneseThaiTlingit-HaidaTohono O'OdhamTonganTrinidadian and TobagonianTsimshianTurkishU.S. Virgin IslanderUgandanUkrainianUruguayanUteVenezuelanVietnameseWelshWest IndianYakamaYaquiYugoslavianYumanYup'ikZimbabwean
Immigration
NonimmigrantsImmigrantsAfghanistanAfricaAlbaniaArgentinaArmeniaAsiaAustraliaAustriaBahamasBangladeshBarbadosBelarusBelgiumBelizeBoliviaBosnia and HerzegovinaBrazilBulgariaBurma/MyanmarCabo VerdeCambodiaCameroonCanadaCaribbeanCentral AmericaChileChinaColombiaCongoCosta RicaCroatiaCubaCzechoslovakiaDenmarkDominicaDominican RepublicEastern AfricaEastern AsiaEastern EuropeEcuadorEgyptEl SalvadorEnglandEritreaEthiopiaEuropeFijiFranceGermanyGhanaGreeceGrenadaGuatemalaGuyanaHaitiHondurasHong KongHungaryIndiaIndonesiaIranIraqIrelandIsraelItalyJamaicaJapanJordanKazakhstanKenyaKoreaKuwaitLaosLatin AmericaLatviaLebanonLiberiaLithuaniaMalaysiaMexicoMicronesiaMiddle AfricaMoldovaMoroccoNepalNetherlandsNicaraguaNigeriaNorth AmericaNorth MacedoniaNorthern AfricaNorthern EuropeNorwayOceaniaPakistanPanamaPeruPhilippinesPolandPortugalRomaniaRussiaSaudi ArabiaScotlandSenegalSerbiaSierra LeoneSingaporeSomaliaSouth AfricaSouth AmericaSouth Central AsiaSouth Eastern AsiaSouthern EuropeSpainSri LankaSt. Vincent and the GrenadinesSudanSwedenSwitzerlandSyriaTaiwanThailandTrinidad and TobagoTurkeyUgandaUkraineUruguayUzbekistanVenezuelaVietnamWest IndiesWestern AfricaWestern AsiaWestern EuropeYemenZaireZimbabweAzores
Female Disability
Income
Poverty
Unemployment
Labor Participation
Family Structure
Vehicle Availability
Education Level
Disability

Female Disability Comparison

Cheyenne

Icelanders

Tragic
Excellent
13.0%
FEMALE DISABILITY
0.1/ 100
METRIC RATING
275th/ 347
METRIC RANK
12.0%
FEMALE DISABILITY
80.7/ 100
METRIC RATING
151st/ 347
METRIC RANK

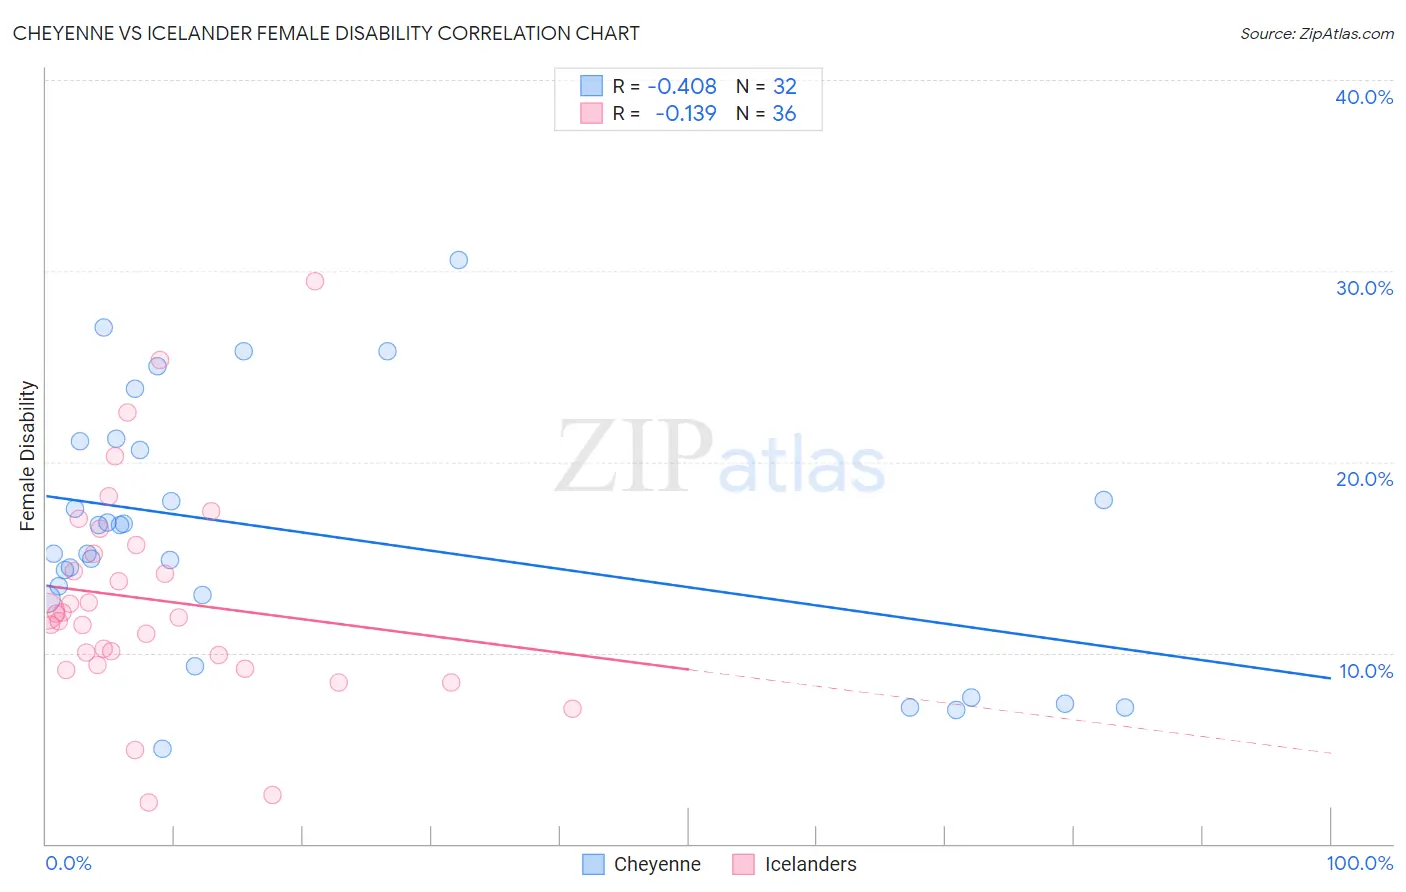
Cheyenne vs Icelander Female Disability Correlation Chart

The statistical analysis conducted on geographies consisting of 80,710,076 people shows a moderate negative correlation between the proportion of Cheyenne and percentage of females with a disability in the United States with a correlation coefficient (R) of -0.408 and weighted average of 13.0%. Similarly, the statistical analysis conducted on geographies consisting of 159,642,732 people shows a poor negative correlation between the proportion of Icelanders and percentage of females with a disability in the United States with a correlation coefficient (R) of -0.139 and weighted average of 12.0%, a difference of 7.8%.
Cheyenne vs Icelander Female Disability

Female Disability Correlation Summary

MeasurementCheyenneIcelander
Minimum5.0%2.2%
Maximum30.6%29.5%
Range25.6%27.3%
Mean16.3%12.8%
Median16.0%12.0%
Interquartile 25% (IQ1)12.9%9.6%
Interquartile 75% (IQ3)20.9%15.4%
Interquartile Range (IQR)7.9%5.8%
Standard Deviation (Sample)6.6%5.7%
Standard Deviation (Population)6.5%5.6%

Similar Demographics by Female Disability

Demographics Similar to Cheyenne by Female Disability

In terms of female disability, the demographic groups most similar to Cheyenne are Portuguese (13.0%, a difference of 0.050%), Immigrants from Dominica (13.0%, a difference of 0.050%), Sioux (12.9%, a difference of 0.17%), German (12.9%, a difference of 0.19%), and Spanish (13.0%, a difference of 0.25%).
DemographicsRating | RankFemale Disability
Immigrants | Laos
0.4
/100
|
#268
Tragic
12.8%
Indonesians
0.4
/100
|
#269
Tragic
12.8%
Immigrants | Liberia
0.3
/100
|
#270
Tragic
12.9%
Dutch
0.2
/100
|
#271
Tragic
12.9%
Germans
0.1
/100
|
#272
Tragic
12.9%
Sioux
0.1
/100
|
#273
Tragic
12.9%
Portuguese
0.1
/100
|
#274
Tragic
13.0%
Cheyenne
0.1
/100
|
#275
Tragic
13.0%
Immigrants | Dominica
0.1
/100
|
#276
Tragic
13.0%
Spanish
0.1
/100
|
#277
Tragic
13.0%
Scottish
0.1
/100
|
#278
Tragic
13.0%
Arapaho
0.1
/100
|
#279
Tragic
13.0%
Irish
0.1
/100
|
#280
Tragic
13.1%
U.S. Virgin Islanders
0.1
/100
|
#281
Tragic
13.1%
Welsh
0.0
/100
|
#282
Tragic
13.1%

Demographics Similar to Icelanders by Female Disability

In terms of female disability, the demographic groups most similar to Icelanders are Immigrants from Moldova (12.0%, a difference of 0.040%), Greek (12.0%, a difference of 0.080%), Immigrants from Scotland (12.0%, a difference of 0.090%), Sudanese (12.0%, a difference of 0.090%), and Immigrants from Kenya (12.0%, a difference of 0.15%).
DemographicsRating | RankFemale Disability
Immigrants | Austria
87.9
/100
|
#144
Excellent
12.0%
Estonians
87.8
/100
|
#145
Excellent
12.0%
Pakistanis
84.6
/100
|
#146
Excellent
12.0%
Nigerians
84.0
/100
|
#147
Excellent
12.0%
Immigrants | Kenya
83.1
/100
|
#148
Excellent
12.0%
Greeks
82.0
/100
|
#149
Excellent
12.0%
Immigrants | Moldova
81.4
/100
|
#150
Excellent
12.0%
Icelanders
80.7
/100
|
#151
Excellent
12.0%
Immigrants | Scotland
79.3
/100
|
#152
Good
12.0%
Sudanese
79.1
/100
|
#153
Good
12.0%
Syrians
76.9
/100
|
#154
Good
12.1%
Ghanaians
76.6
/100
|
#155
Good
12.1%
Moroccans
72.9
/100
|
#156
Good
12.1%
Danes
72.5
/100
|
#157
Good
12.1%
Immigrants | Middle Africa
72.4
/100
|
#158
Good
12.1%