Filipino vs Icelander Female Disability
COMPARE
Filipino
Icelander
Female Disability
Female Disability Comparison
Filipinos
Icelanders
10.1%
FEMALE DISABILITY
100.0/ 100
METRIC RATING
2nd/ 347
METRIC RANK
12.0%
FEMALE DISABILITY
80.7/ 100
METRIC RATING
151st/ 347
METRIC RANK
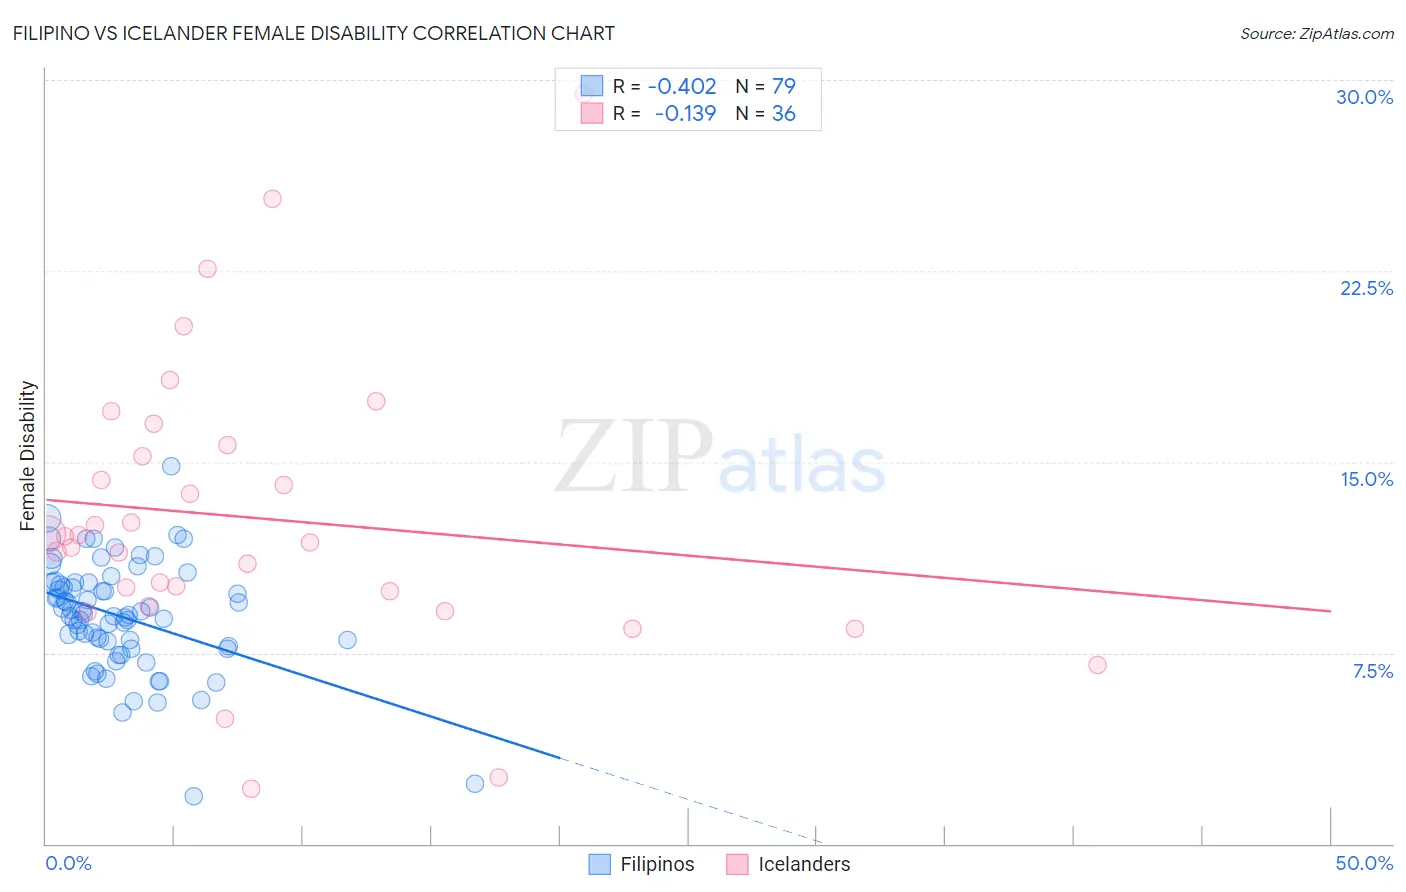
Filipino vs Icelander Female Disability Correlation Chart
The statistical analysis conducted on geographies consisting of 254,340,096 people shows a moderate negative correlation between the proportion of Filipinos and percentage of females with a disability in the United States with a correlation coefficient (R) of -0.402 and weighted average of 10.1%. Similarly, the statistical analysis conducted on geographies consisting of 159,642,732 people shows a poor negative correlation between the proportion of Icelanders and percentage of females with a disability in the United States with a correlation coefficient (R) of -0.139 and weighted average of 12.0%, a difference of 19.5%.
Female Disability Correlation Summary
| Measurement | Filipino | Icelander |
| Minimum | 1.9% | 2.2% |
| Maximum | 14.8% | 29.5% |
| Range | 13.0% | 27.3% |
| Mean | 8.9% | 12.8% |
| Median | 9.0% | 12.0% |
| Interquartile 25% (IQ1) | 7.8% | 9.6% |
| Interquartile 75% (IQ3) | 10.3% | 15.4% |
| Interquartile Range (IQR) | 2.5% | 5.8% |
| Standard Deviation (Sample) | 2.2% | 5.7% |
| Standard Deviation (Population) | 2.1% | 5.6% |
Similar Demographics by Female Disability
Demographics Similar to Filipinos by Female Disability
In terms of female disability, the demographic groups most similar to Filipinos are Immigrants from Taiwan (10.1%, a difference of 0.23%), Immigrants from India (10.0%, a difference of 0.93%), Thai (10.2%, a difference of 1.1%), Immigrants from Bolivia (10.3%, a difference of 1.9%), and Bolivian (10.4%, a difference of 2.9%).
| Demographics | Rating | Rank | Female Disability |
| Immigrants | India | 100.0 /100 | #1 | Exceptional 10.0% |
| Filipinos | 100.0 /100 | #2 | Exceptional 10.1% |
| Immigrants | Taiwan | 100.0 /100 | #3 | Exceptional 10.1% |
| Thais | 100.0 /100 | #4 | Exceptional 10.2% |
| Immigrants | Bolivia | 100.0 /100 | #5 | Exceptional 10.3% |
| Bolivians | 100.0 /100 | #6 | Exceptional 10.4% |
| Immigrants | Singapore | 100.0 /100 | #7 | Exceptional 10.4% |
| Immigrants | South Central Asia | 100.0 /100 | #8 | Exceptional 10.5% |
| Iranians | 100.0 /100 | #9 | Exceptional 10.6% |
| Immigrants | Hong Kong | 100.0 /100 | #10 | Exceptional 10.6% |
| Immigrants | Korea | 100.0 /100 | #11 | Exceptional 10.6% |
| Immigrants | Israel | 100.0 /100 | #12 | Exceptional 10.7% |
| Immigrants | Eastern Asia | 100.0 /100 | #13 | Exceptional 10.7% |
| Immigrants | China | 100.0 /100 | #14 | Exceptional 10.7% |
| Burmese | 100.0 /100 | #15 | Exceptional 10.7% |
Demographics Similar to Icelanders by Female Disability
In terms of female disability, the demographic groups most similar to Icelanders are Immigrants from Moldova (12.0%, a difference of 0.040%), Greek (12.0%, a difference of 0.080%), Immigrants from Scotland (12.0%, a difference of 0.090%), Sudanese (12.0%, a difference of 0.090%), and Immigrants from Kenya (12.0%, a difference of 0.15%).
| Demographics | Rating | Rank | Female Disability |
| Immigrants | Austria | 87.9 /100 | #144 | Excellent 12.0% |
| Estonians | 87.8 /100 | #145 | Excellent 12.0% |
| Pakistanis | 84.6 /100 | #146 | Excellent 12.0% |
| Nigerians | 84.0 /100 | #147 | Excellent 12.0% |
| Immigrants | Kenya | 83.1 /100 | #148 | Excellent 12.0% |
| Greeks | 82.0 /100 | #149 | Excellent 12.0% |
| Immigrants | Moldova | 81.4 /100 | #150 | Excellent 12.0% |
| Icelanders | 80.7 /100 | #151 | Excellent 12.0% |
| Immigrants | Scotland | 79.3 /100 | #152 | Good 12.0% |
| Sudanese | 79.1 /100 | #153 | Good 12.0% |
| Syrians | 76.9 /100 | #154 | Good 12.1% |
| Ghanaians | 76.6 /100 | #155 | Good 12.1% |
| Moroccans | 72.9 /100 | #156 | Good 12.1% |
| Danes | 72.5 /100 | #157 | Good 12.1% |
| Immigrants | Middle Africa | 72.4 /100 | #158 | Good 12.1% |