Pueblo vs Puerto Rican Female Disability
COMPARE
Pueblo
Puerto Rican
Female Disability
Female Disability Comparison
Pueblo
Puerto Ricans
14.1%
FEMALE DISABILITY
0.0/ 100
METRIC RATING
322nd/ 347
METRIC RANK
16.6%
FEMALE DISABILITY
0.0/ 100
METRIC RATING
345th/ 347
METRIC RANK
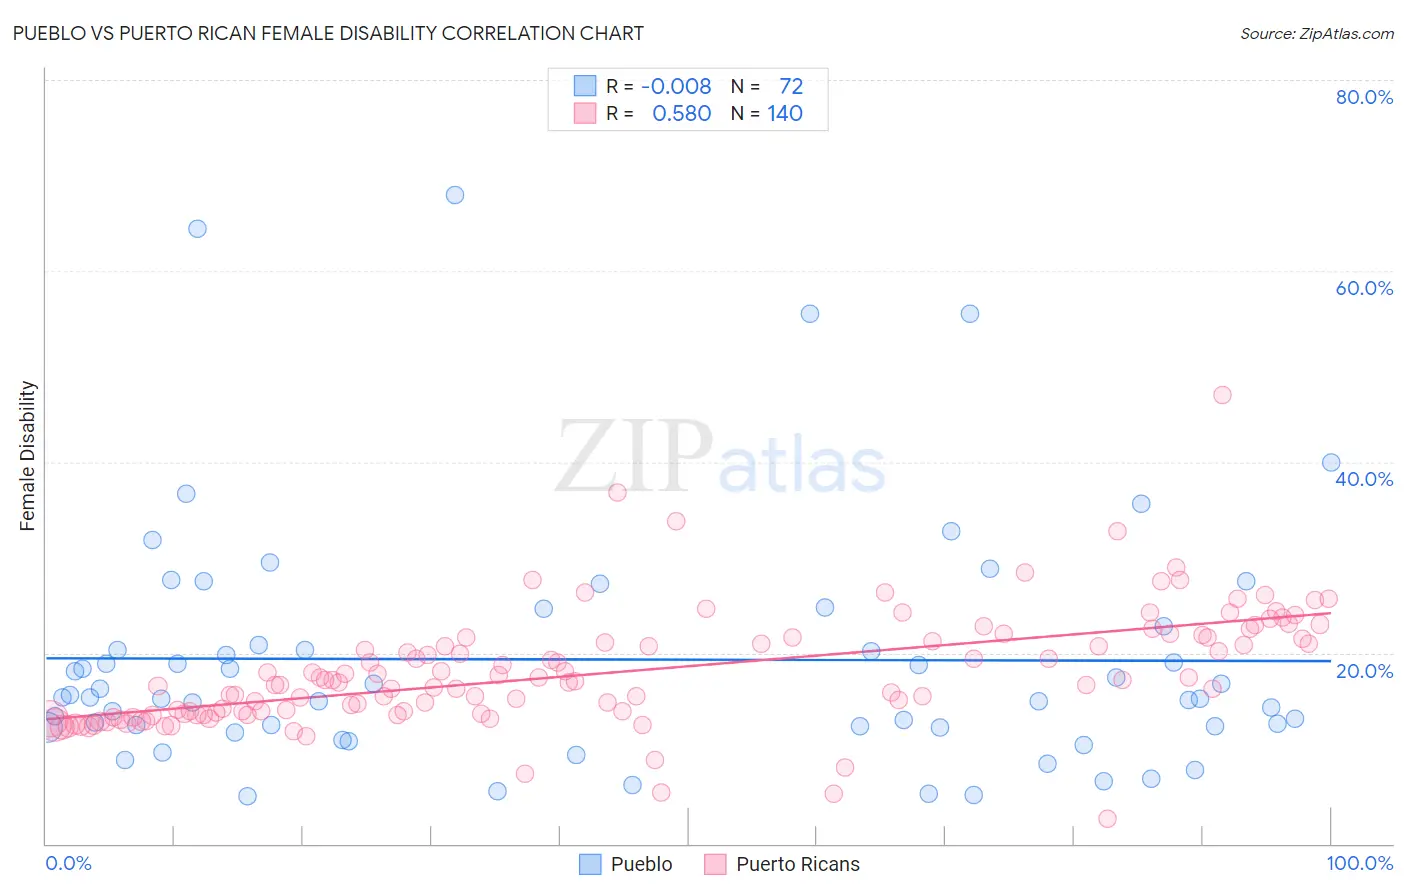
Pueblo vs Puerto Rican Female Disability Correlation Chart
The statistical analysis conducted on geographies consisting of 120,072,777 people shows no correlation between the proportion of Pueblo and percentage of females with a disability in the United States with a correlation coefficient (R) of -0.008 and weighted average of 14.1%. Similarly, the statistical analysis conducted on geographies consisting of 528,098,976 people shows a substantial positive correlation between the proportion of Puerto Ricans and percentage of females with a disability in the United States with a correlation coefficient (R) of 0.580 and weighted average of 16.6%, a difference of 17.7%.
Female Disability Correlation Summary
| Measurement | Pueblo | Puerto Rican |
| Minimum | 5.0% | 2.6% |
| Maximum | 67.9% | 47.0% |
| Range | 62.9% | 44.3% |
| Mean | 19.3% | 18.0% |
| Median | 15.4% | 16.9% |
| Interquartile 25% (IQ1) | 12.3% | 13.6% |
| Interquartile 75% (IQ3) | 21.8% | 21.5% |
| Interquartile Range (IQR) | 9.5% | 7.9% |
| Standard Deviation (Sample) | 12.9% | 6.1% |
| Standard Deviation (Population) | 12.8% | 6.1% |
Similar Demographics by Female Disability
Demographics Similar to Pueblo by Female Disability
In terms of female disability, the demographic groups most similar to Pueblo are Potawatomi (14.1%, a difference of 0.010%), American (14.1%, a difference of 0.15%), Black/African American (14.1%, a difference of 0.17%), Native/Alaskan (14.1%, a difference of 0.18%), and Navajo (14.2%, a difference of 0.32%).
| Demographics | Rating | Rank | Female Disability |
| Alaskan Athabascans | 0.0 /100 | #315 | Tragic 13.9% |
| Spanish Americans | 0.0 /100 | #316 | Tragic 14.0% |
| Chippewa | 0.0 /100 | #317 | Tragic 14.0% |
| Paiute | 0.0 /100 | #318 | Tragic 14.0% |
| Iroquois | 0.0 /100 | #319 | Tragic 14.0% |
| Americans | 0.0 /100 | #320 | Tragic 14.1% |
| Potawatomi | 0.0 /100 | #321 | Tragic 14.1% |
| Pueblo | 0.0 /100 | #322 | Tragic 14.1% |
| Blacks/African Americans | 0.0 /100 | #323 | Tragic 14.1% |
| Natives/Alaskans | 0.0 /100 | #324 | Tragic 14.1% |
| Navajo | 0.0 /100 | #325 | Tragic 14.2% |
| Comanche | 0.0 /100 | #326 | Tragic 14.2% |
| Ottawa | 0.0 /100 | #327 | Tragic 14.2% |
| Cape Verdeans | 0.0 /100 | #328 | Tragic 14.2% |
| Osage | 0.0 /100 | #329 | Tragic 14.3% |
Demographics Similar to Puerto Ricans by Female Disability
In terms of female disability, the demographic groups most similar to Puerto Ricans are Tsimshian (16.8%, a difference of 0.94%), Houma (16.9%, a difference of 1.7%), Kiowa (15.8%, a difference of 5.2%), Lumbee (15.8%, a difference of 5.3%), and Creek (15.7%, a difference of 6.1%).
| Demographics | Rating | Rank | Female Disability |
| Immigrants | Azores | 0.0 /100 | #333 | Tragic 14.9% |
| Cherokee | 0.0 /100 | #334 | Tragic 14.9% |
| Cajuns | 0.0 /100 | #335 | Tragic 14.9% |
| Seminole | 0.0 /100 | #336 | Tragic 15.0% |
| Tohono O'odham | 0.0 /100 | #337 | Tragic 15.0% |
| Dutch West Indians | 0.0 /100 | #338 | Tragic 15.0% |
| Colville | 0.0 /100 | #339 | Tragic 15.1% |
| Chickasaw | 0.0 /100 | #340 | Tragic 15.2% |
| Choctaw | 0.0 /100 | #341 | Tragic 15.4% |
| Creek | 0.0 /100 | #342 | Tragic 15.7% |
| Lumbee | 0.0 /100 | #343 | Tragic 15.8% |
| Kiowa | 0.0 /100 | #344 | Tragic 15.8% |
| Puerto Ricans | 0.0 /100 | #345 | Tragic 16.6% |
| Tsimshian | 0.0 /100 | #346 | Tragic 16.8% |
| Houma | 0.0 /100 | #347 | Tragic 16.9% |