Zimbabwean vs Puerto Rican Female Disability
COMPARE
Zimbabwean
Puerto Rican
Female Disability
Female Disability Comparison
Zimbabweans
Puerto Ricans
11.3%
FEMALE DISABILITY
100.0/ 100
METRIC RATING
48th/ 347
METRIC RANK
16.6%
FEMALE DISABILITY
0.0/ 100
METRIC RATING
345th/ 347
METRIC RANK
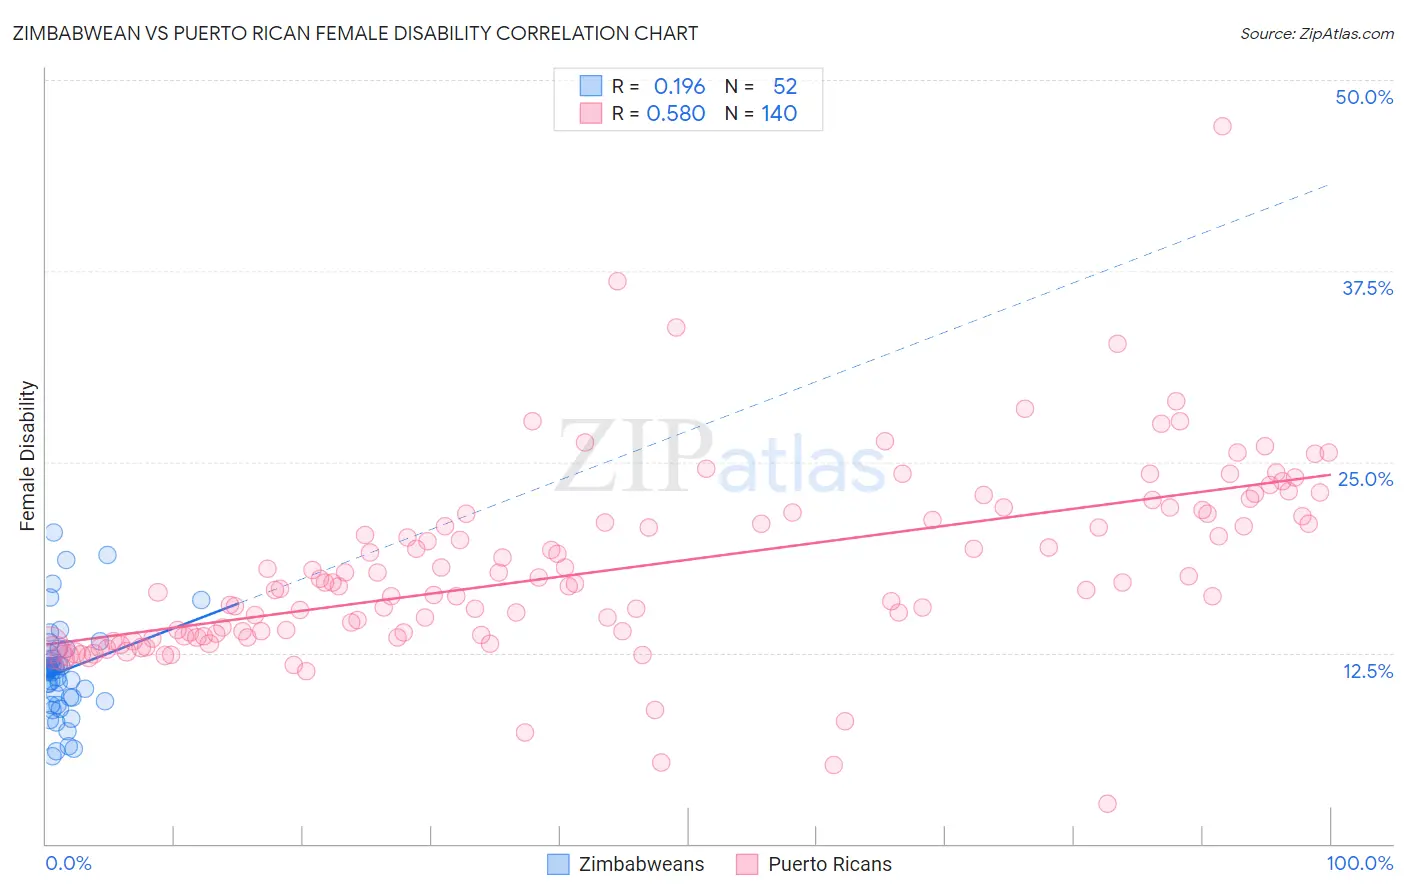
Zimbabwean vs Puerto Rican Female Disability Correlation Chart
The statistical analysis conducted on geographies consisting of 69,206,785 people shows a poor positive correlation between the proportion of Zimbabweans and percentage of females with a disability in the United States with a correlation coefficient (R) of 0.196 and weighted average of 11.3%. Similarly, the statistical analysis conducted on geographies consisting of 528,098,976 people shows a substantial positive correlation between the proportion of Puerto Ricans and percentage of females with a disability in the United States with a correlation coefficient (R) of 0.580 and weighted average of 16.6%, a difference of 47.4%.
Female Disability Correlation Summary
| Measurement | Zimbabwean | Puerto Rican |
| Minimum | 5.7% | 2.6% |
| Maximum | 20.3% | 47.0% |
| Range | 14.6% | 44.3% |
| Mean | 11.3% | 18.0% |
| Median | 11.3% | 16.9% |
| Interquartile 25% (IQ1) | 9.5% | 13.6% |
| Interquartile 75% (IQ3) | 12.2% | 21.5% |
| Interquartile Range (IQR) | 2.8% | 7.9% |
| Standard Deviation (Sample) | 3.1% | 6.1% |
| Standard Deviation (Population) | 3.1% | 6.1% |
Similar Demographics by Female Disability
Demographics Similar to Zimbabweans by Female Disability
In terms of female disability, the demographic groups most similar to Zimbabweans are Jordanian (11.3%, a difference of 0.0%), Tongan (11.3%, a difference of 0.010%), Immigrants from Nepal (11.3%, a difference of 0.020%), Immigrants from Sweden (11.3%, a difference of 0.070%), and Cambodian (11.3%, a difference of 0.11%).
| Demographics | Rating | Rank | Female Disability |
| Paraguayans | 100.0 /100 | #41 | Exceptional 11.2% |
| Israelis | 100.0 /100 | #42 | Exceptional 11.2% |
| Afghans | 100.0 /100 | #43 | Exceptional 11.2% |
| Cambodians | 100.0 /100 | #44 | Exceptional 11.3% |
| Immigrants | Sweden | 100.0 /100 | #45 | Exceptional 11.3% |
| Immigrants | Nepal | 100.0 /100 | #46 | Exceptional 11.3% |
| Jordanians | 100.0 /100 | #47 | Exceptional 11.3% |
| Zimbabweans | 100.0 /100 | #48 | Exceptional 11.3% |
| Tongans | 100.0 /100 | #49 | Exceptional 11.3% |
| Inupiat | 100.0 /100 | #50 | Exceptional 11.3% |
| Immigrants | Belgium | 100.0 /100 | #51 | Exceptional 11.3% |
| Immigrants | Peru | 99.9 /100 | #52 | Exceptional 11.3% |
| Immigrants | Saudi Arabia | 99.9 /100 | #53 | Exceptional 11.3% |
| Peruvians | 99.9 /100 | #54 | Exceptional 11.3% |
| Bulgarians | 99.9 /100 | #55 | Exceptional 11.3% |
Demographics Similar to Puerto Ricans by Female Disability
In terms of female disability, the demographic groups most similar to Puerto Ricans are Tsimshian (16.8%, a difference of 0.94%), Houma (16.9%, a difference of 1.7%), Kiowa (15.8%, a difference of 5.2%), Lumbee (15.8%, a difference of 5.3%), and Creek (15.7%, a difference of 6.1%).
| Demographics | Rating | Rank | Female Disability |
| Immigrants | Azores | 0.0 /100 | #333 | Tragic 14.9% |
| Cherokee | 0.0 /100 | #334 | Tragic 14.9% |
| Cajuns | 0.0 /100 | #335 | Tragic 14.9% |
| Seminole | 0.0 /100 | #336 | Tragic 15.0% |
| Tohono O'odham | 0.0 /100 | #337 | Tragic 15.0% |
| Dutch West Indians | 0.0 /100 | #338 | Tragic 15.0% |
| Colville | 0.0 /100 | #339 | Tragic 15.1% |
| Chickasaw | 0.0 /100 | #340 | Tragic 15.2% |
| Choctaw | 0.0 /100 | #341 | Tragic 15.4% |
| Creek | 0.0 /100 | #342 | Tragic 15.7% |
| Lumbee | 0.0 /100 | #343 | Tragic 15.8% |
| Kiowa | 0.0 /100 | #344 | Tragic 15.8% |
| Puerto Ricans | 0.0 /100 | #345 | Tragic 16.6% |
| Tsimshian | 0.0 /100 | #346 | Tragic 16.8% |
| Houma | 0.0 /100 | #347 | Tragic 16.9% |