Immigrants from Sierra Leone vs Puerto Rican Female Disability
COMPARE
Immigrants from Sierra Leone
Puerto Rican
Female Disability
Female Disability Comparison
Immigrants from Sierra Leone
Puerto Ricans
11.6%
FEMALE DISABILITY
99.4/ 100
METRIC RATING
93rd/ 347
METRIC RANK
16.6%
FEMALE DISABILITY
0.0/ 100
METRIC RATING
345th/ 347
METRIC RANK
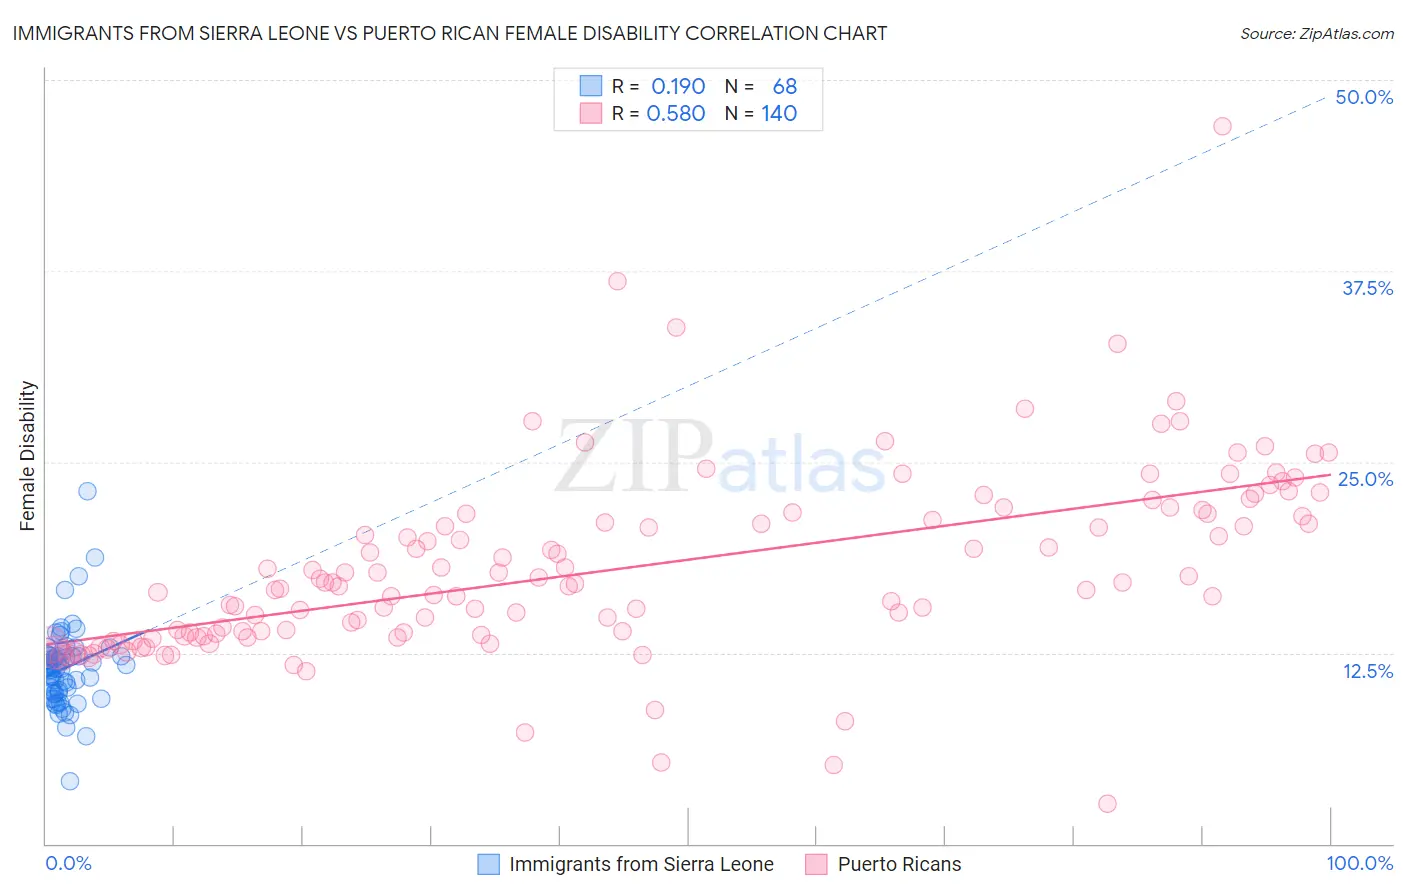
Immigrants from Sierra Leone vs Puerto Rican Female Disability Correlation Chart
The statistical analysis conducted on geographies consisting of 101,646,950 people shows a poor positive correlation between the proportion of Immigrants from Sierra Leone and percentage of females with a disability in the United States with a correlation coefficient (R) of 0.190 and weighted average of 11.6%. Similarly, the statistical analysis conducted on geographies consisting of 528,098,976 people shows a substantial positive correlation between the proportion of Puerto Ricans and percentage of females with a disability in the United States with a correlation coefficient (R) of 0.580 and weighted average of 16.6%, a difference of 43.2%.
Female Disability Correlation Summary
| Measurement | Immigrants from Sierra Leone | Puerto Rican |
| Minimum | 4.1% | 2.6% |
| Maximum | 23.1% | 47.0% |
| Range | 18.9% | 44.3% |
| Mean | 11.5% | 18.0% |
| Median | 11.5% | 16.9% |
| Interquartile 25% (IQ1) | 9.8% | 13.6% |
| Interquartile 75% (IQ3) | 12.3% | 21.5% |
| Interquartile Range (IQR) | 2.5% | 7.9% |
| Standard Deviation (Sample) | 2.7% | 6.1% |
| Standard Deviation (Population) | 2.7% | 6.1% |
Similar Demographics by Female Disability
Demographics Similar to Immigrants from Sierra Leone by Female Disability
In terms of female disability, the demographic groups most similar to Immigrants from Sierra Leone are Immigrants from Brazil (11.6%, a difference of 0.030%), Immigrants from Czechoslovakia (11.6%, a difference of 0.10%), Immigrants from Northern Europe (11.6%, a difference of 0.10%), Immigrants from Zimbabwe (11.6%, a difference of 0.11%), and Vietnamese (11.6%, a difference of 0.12%).
| Demographics | Rating | Rank | Female Disability |
| Immigrants | Cameroon | 99.6 /100 | #86 | Exceptional 11.6% |
| Immigrants | Denmark | 99.5 /100 | #87 | Exceptional 11.6% |
| Yup'ik | 99.5 /100 | #88 | Exceptional 11.6% |
| Vietnamese | 99.5 /100 | #89 | Exceptional 11.6% |
| Immigrants | Romania | 99.5 /100 | #90 | Exceptional 11.6% |
| Immigrants | Zimbabwe | 99.5 /100 | #91 | Exceptional 11.6% |
| Immigrants | Czechoslovakia | 99.5 /100 | #92 | Exceptional 11.6% |
| Immigrants | Sierra Leone | 99.4 /100 | #93 | Exceptional 11.6% |
| Immigrants | Brazil | 99.4 /100 | #94 | Exceptional 11.6% |
| Immigrants | Northern Europe | 99.4 /100 | #95 | Exceptional 11.6% |
| Immigrants | Russia | 99.0 /100 | #96 | Exceptional 11.7% |
| Koreans | 99.0 /100 | #97 | Exceptional 11.7% |
| Uruguayans | 98.8 /100 | #98 | Exceptional 11.7% |
| Immigrants | Philippines | 98.6 /100 | #99 | Exceptional 11.7% |
| Immigrants | Uruguay | 98.5 /100 | #100 | Exceptional 11.7% |
Demographics Similar to Puerto Ricans by Female Disability
In terms of female disability, the demographic groups most similar to Puerto Ricans are Tsimshian (16.8%, a difference of 0.94%), Houma (16.9%, a difference of 1.7%), Kiowa (15.8%, a difference of 5.2%), Lumbee (15.8%, a difference of 5.3%), and Creek (15.7%, a difference of 6.1%).
| Demographics | Rating | Rank | Female Disability |
| Immigrants | Azores | 0.0 /100 | #333 | Tragic 14.9% |
| Cherokee | 0.0 /100 | #334 | Tragic 14.9% |
| Cajuns | 0.0 /100 | #335 | Tragic 14.9% |
| Seminole | 0.0 /100 | #336 | Tragic 15.0% |
| Tohono O'odham | 0.0 /100 | #337 | Tragic 15.0% |
| Dutch West Indians | 0.0 /100 | #338 | Tragic 15.0% |
| Colville | 0.0 /100 | #339 | Tragic 15.1% |
| Chickasaw | 0.0 /100 | #340 | Tragic 15.2% |
| Choctaw | 0.0 /100 | #341 | Tragic 15.4% |
| Creek | 0.0 /100 | #342 | Tragic 15.7% |
| Lumbee | 0.0 /100 | #343 | Tragic 15.8% |
| Kiowa | 0.0 /100 | #344 | Tragic 15.8% |
| Puerto Ricans | 0.0 /100 | #345 | Tragic 16.6% |
| Tsimshian | 0.0 /100 | #346 | Tragic 16.8% |
| Houma | 0.0 /100 | #347 | Tragic 16.9% |