Immigrants from Saudi Arabia vs Puerto Rican Female Disability
COMPARE
Immigrants from Saudi Arabia
Puerto Rican
Female Disability
Female Disability Comparison
Immigrants from Saudi Arabia
Puerto Ricans
11.3%
FEMALE DISABILITY
99.9/ 100
METRIC RATING
53rd/ 347
METRIC RANK
16.6%
FEMALE DISABILITY
0.0/ 100
METRIC RATING
345th/ 347
METRIC RANK
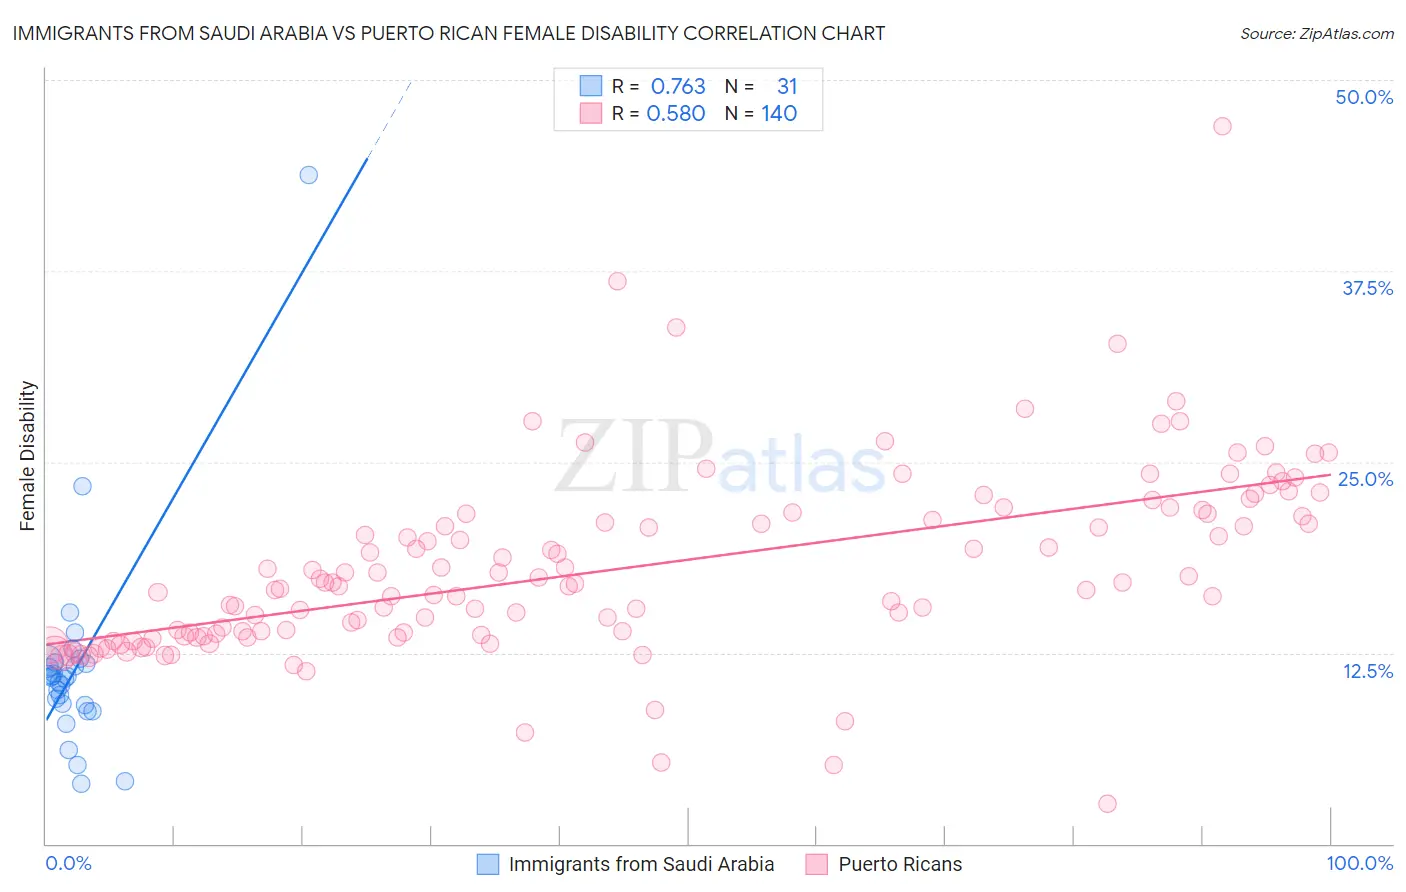
Immigrants from Saudi Arabia vs Puerto Rican Female Disability Correlation Chart
The statistical analysis conducted on geographies consisting of 164,285,466 people shows a strong positive correlation between the proportion of Immigrants from Saudi Arabia and percentage of females with a disability in the United States with a correlation coefficient (R) of 0.763 and weighted average of 11.3%. Similarly, the statistical analysis conducted on geographies consisting of 528,098,976 people shows a substantial positive correlation between the proportion of Puerto Ricans and percentage of females with a disability in the United States with a correlation coefficient (R) of 0.580 and weighted average of 16.6%, a difference of 46.7%.
Female Disability Correlation Summary
| Measurement | Immigrants from Saudi Arabia | Puerto Rican |
| Minimum | 3.9% | 2.6% |
| Maximum | 43.8% | 47.0% |
| Range | 39.8% | 44.3% |
| Mean | 11.6% | 18.0% |
| Median | 10.9% | 16.9% |
| Interquartile 25% (IQ1) | 9.1% | 13.6% |
| Interquartile 75% (IQ3) | 11.9% | 21.5% |
| Interquartile Range (IQR) | 2.8% | 7.9% |
| Standard Deviation (Sample) | 6.9% | 6.1% |
| Standard Deviation (Population) | 6.8% | 6.1% |
Similar Demographics by Female Disability
Demographics Similar to Immigrants from Saudi Arabia by Female Disability
In terms of female disability, the demographic groups most similar to Immigrants from Saudi Arabia are Immigrants from Peru (11.3%, a difference of 0.040%), Peruvian (11.3%, a difference of 0.060%), Bulgarian (11.3%, a difference of 0.070%), Immigrants from Belgium (11.3%, a difference of 0.16%), and Inupiat (11.3%, a difference of 0.24%).
| Demographics | Rating | Rank | Female Disability |
| Immigrants | Nepal | 100.0 /100 | #46 | Exceptional 11.3% |
| Jordanians | 100.0 /100 | #47 | Exceptional 11.3% |
| Zimbabweans | 100.0 /100 | #48 | Exceptional 11.3% |
| Tongans | 100.0 /100 | #49 | Exceptional 11.3% |
| Inupiat | 100.0 /100 | #50 | Exceptional 11.3% |
| Immigrants | Belgium | 100.0 /100 | #51 | Exceptional 11.3% |
| Immigrants | Peru | 99.9 /100 | #52 | Exceptional 11.3% |
| Immigrants | Saudi Arabia | 99.9 /100 | #53 | Exceptional 11.3% |
| Peruvians | 99.9 /100 | #54 | Exceptional 11.3% |
| Bulgarians | 99.9 /100 | #55 | Exceptional 11.3% |
| Taiwanese | 99.9 /100 | #56 | Exceptional 11.4% |
| South Americans | 99.9 /100 | #57 | Exceptional 11.4% |
| Laotians | 99.9 /100 | #58 | Exceptional 11.4% |
| Immigrants | Spain | 99.9 /100 | #59 | Exceptional 11.4% |
| Immigrants | Bulgaria | 99.9 /100 | #60 | Exceptional 11.4% |
Demographics Similar to Puerto Ricans by Female Disability
In terms of female disability, the demographic groups most similar to Puerto Ricans are Tsimshian (16.8%, a difference of 0.94%), Houma (16.9%, a difference of 1.7%), Kiowa (15.8%, a difference of 5.2%), Lumbee (15.8%, a difference of 5.3%), and Creek (15.7%, a difference of 6.1%).
| Demographics | Rating | Rank | Female Disability |
| Immigrants | Azores | 0.0 /100 | #333 | Tragic 14.9% |
| Cherokee | 0.0 /100 | #334 | Tragic 14.9% |
| Cajuns | 0.0 /100 | #335 | Tragic 14.9% |
| Seminole | 0.0 /100 | #336 | Tragic 15.0% |
| Tohono O'odham | 0.0 /100 | #337 | Tragic 15.0% |
| Dutch West Indians | 0.0 /100 | #338 | Tragic 15.0% |
| Colville | 0.0 /100 | #339 | Tragic 15.1% |
| Chickasaw | 0.0 /100 | #340 | Tragic 15.2% |
| Choctaw | 0.0 /100 | #341 | Tragic 15.4% |
| Creek | 0.0 /100 | #342 | Tragic 15.7% |
| Lumbee | 0.0 /100 | #343 | Tragic 15.8% |
| Kiowa | 0.0 /100 | #344 | Tragic 15.8% |
| Puerto Ricans | 0.0 /100 | #345 | Tragic 16.6% |
| Tsimshian | 0.0 /100 | #346 | Tragic 16.8% |
| Houma | 0.0 /100 | #347 | Tragic 16.9% |