Pueblo vs Puerto Rican Family Households with Children
COMPARE
Pueblo
Puerto Rican
Family Households with Children
Family Households with Children Comparison
Pueblo
Puerto Ricans
25.2%
FAMILY HOUSEHOLDS WITH CHILDREN
0.0/ 100
METRIC RATING
344th/ 347
METRIC RANK
25.6%
FAMILY HOUSEHOLDS WITH CHILDREN
0.0/ 100
METRIC RATING
337th/ 347
METRIC RANK
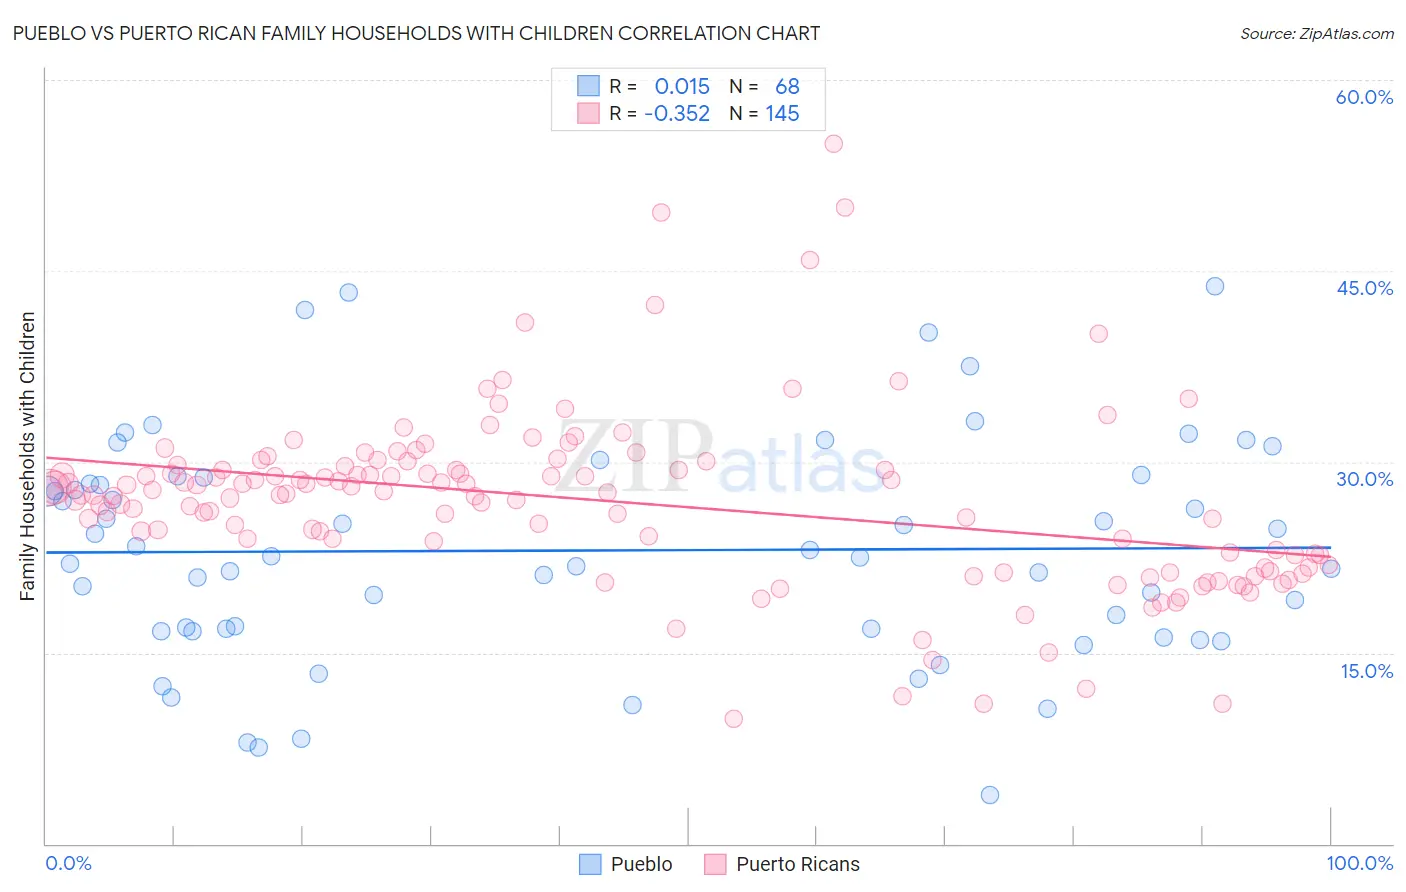
Pueblo vs Puerto Rican Family Households with Children Correlation Chart
The statistical analysis conducted on geographies consisting of 120,047,351 people shows no correlation between the proportion of Pueblo and percentage of family households with children in the United States with a correlation coefficient (R) of 0.015 and weighted average of 25.2%. Similarly, the statistical analysis conducted on geographies consisting of 527,477,936 people shows a mild negative correlation between the proportion of Puerto Ricans and percentage of family households with children in the United States with a correlation coefficient (R) of -0.352 and weighted average of 25.6%, a difference of 1.4%.
Family Households with Children Correlation Summary
| Measurement | Pueblo | Puerto Rican |
| Minimum | 3.8% | 9.8% |
| Maximum | 43.8% | 54.9% |
| Range | 40.0% | 45.1% |
| Mean | 23.0% | 26.9% |
| Median | 22.5% | 27.4% |
| Interquartile 25% (IQ1) | 16.8% | 22.3% |
| Interquartile 75% (IQ3) | 28.5% | 29.5% |
| Interquartile Range (IQR) | 11.7% | 7.3% |
| Standard Deviation (Sample) | 8.7% | 6.9% |
| Standard Deviation (Population) | 8.7% | 6.9% |
Demographics Similar to Pueblo and Puerto Ricans by Family Households with Children
In terms of family households with children, the demographic groups most similar to Pueblo are Hopi (25.2%, a difference of 0.11%), Immigrants from Grenada (25.2%, a difference of 0.18%), Carpatho Rusyn (25.2%, a difference of 0.18%), Alsatian (25.3%, a difference of 0.26%), and Immigrants from Serbia (25.5%, a difference of 0.94%). Similarly, the demographic groups most similar to Puerto Ricans are Arapaho (25.6%, a difference of 0.030%), Immigrants from St. Vincent and the Grenadines (25.6%, a difference of 0.040%), Immigrants from Armenia (25.6%, a difference of 0.080%), Immigrants from West Indies (25.7%, a difference of 0.39%), and Immigrants from Serbia (25.5%, a difference of 0.46%).
| Demographics | Rating | Rank | Family Households with Children |
| Immigrants | Albania | 0.0 /100 | #328 | Tragic 25.9% |
| Cypriots | 0.0 /100 | #329 | Tragic 25.9% |
| Immigrants | Latvia | 0.0 /100 | #330 | Tragic 25.9% |
| Slovenes | 0.0 /100 | #331 | Tragic 25.8% |
| Immigrants | Austria | 0.0 /100 | #332 | Tragic 25.8% |
| Immigrants | Switzerland | 0.0 /100 | #333 | Tragic 25.7% |
| Slovaks | 0.0 /100 | #334 | Tragic 25.7% |
| Immigrants | Croatia | 0.0 /100 | #335 | Tragic 25.7% |
| Immigrants | West Indies | 0.0 /100 | #336 | Tragic 25.7% |
| Puerto Ricans | 0.0 /100 | #337 | Tragic 25.6% |
| Arapaho | 0.0 /100 | #338 | Tragic 25.6% |
| Immigrants | St. Vincent and the Grenadines | 0.0 /100 | #339 | Tragic 25.6% |
| Immigrants | Armenia | 0.0 /100 | #340 | Tragic 25.6% |
| Immigrants | Serbia | 0.0 /100 | #341 | Tragic 25.5% |
| Alsatians | 0.0 /100 | #342 | Tragic 25.3% |
| Hopi | 0.0 /100 | #343 | Tragic 25.2% |
| Pueblo | 0.0 /100 | #344 | Tragic 25.2% |
| Immigrants | Grenada | 0.0 /100 | #345 | Tragic 25.2% |
| Carpatho Rusyns | 0.0 /100 | #346 | Tragic 25.2% |
| Soviet Union | 0.0 /100 | #347 | Tragic 24.8% |