Pueblo vs Puerto Rican College, Under 1 year
COMPARE
Pueblo
Puerto Rican
College, Under 1 year
College, Under 1 year Comparison
Pueblo
Puerto Ricans
57.4%
COLLEGE, UNDER 1 YEAR
0.0/ 100
METRIC RATING
310th/ 347
METRIC RANK
56.8%
COLLEGE, UNDER 1 YEAR
0.0/ 100
METRIC RATING
319th/ 347
METRIC RANK
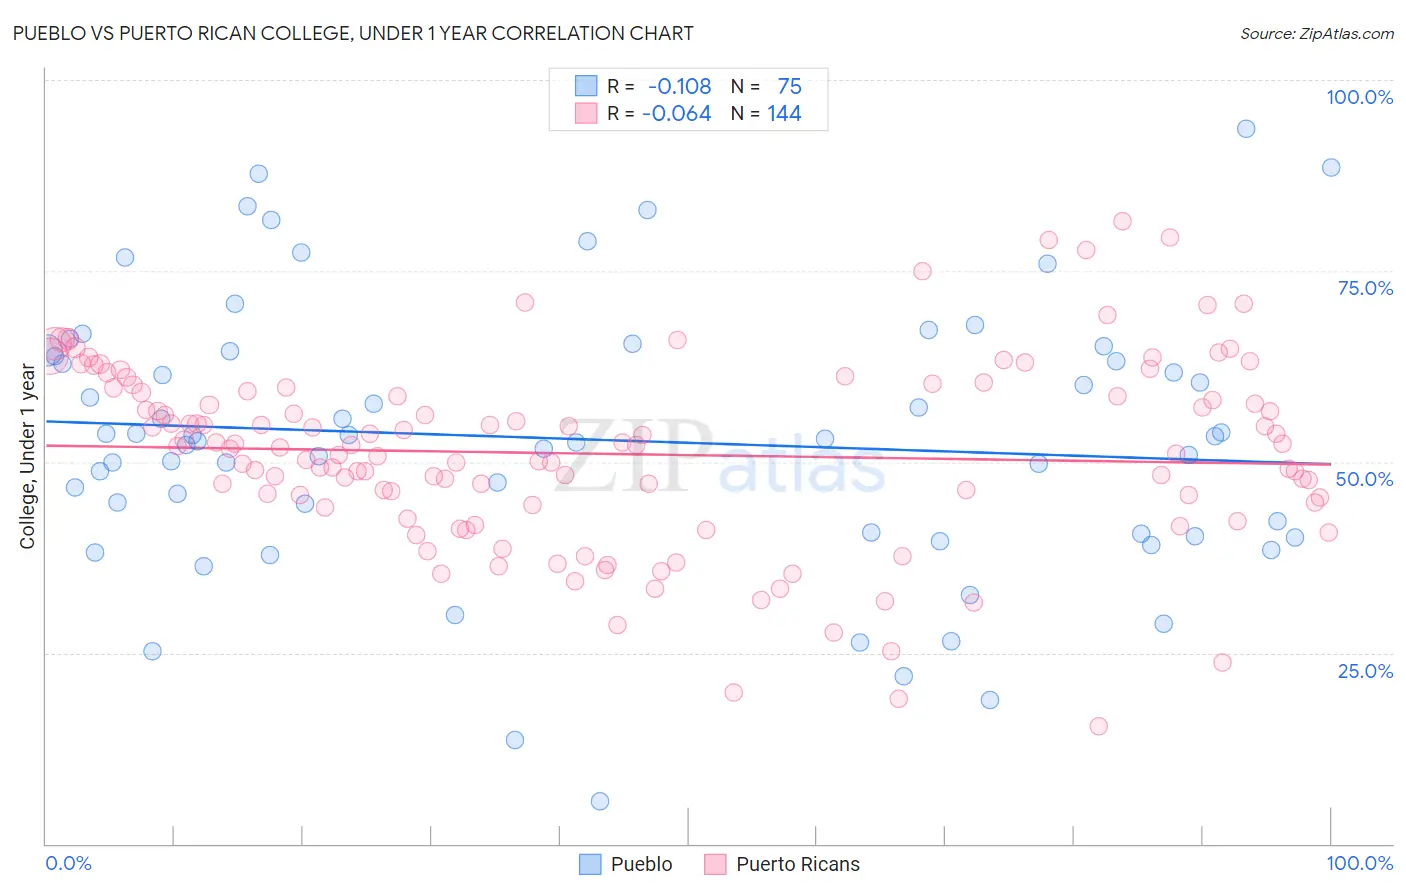
Pueblo vs Puerto Rican College, Under 1 year Correlation Chart
The statistical analysis conducted on geographies consisting of 120,087,269 people shows a poor negative correlation between the proportion of Pueblo and percentage of population with at least college, under 1 year education in the United States with a correlation coefficient (R) of -0.108 and weighted average of 57.4%. Similarly, the statistical analysis conducted on geographies consisting of 528,317,754 people shows a slight negative correlation between the proportion of Puerto Ricans and percentage of population with at least college, under 1 year education in the United States with a correlation coefficient (R) of -0.064 and weighted average of 56.8%, a difference of 0.94%.
College, Under 1 year Correlation Summary
| Measurement | Pueblo | Puerto Rican |
| Minimum | 5.6% | 15.4% |
| Maximum | 93.5% | 81.5% |
| Range | 88.0% | 66.1% |
| Mean | 52.9% | 51.0% |
| Median | 53.0% | 52.0% |
| Interquartile 25% (IQ1) | 40.5% | 44.5% |
| Interquartile 75% (IQ3) | 64.5% | 59.2% |
| Interquartile Range (IQR) | 23.9% | 14.7% |
| Standard Deviation (Sample) | 17.8% | 12.2% |
| Standard Deviation (Population) | 17.7% | 12.2% |
Demographics Similar to Pueblo and Puerto Ricans by College, Under 1 year
In terms of college, under 1 year, the demographic groups most similar to Pueblo are Cajun (57.3%, a difference of 0.060%), Salvadoran (57.3%, a difference of 0.12%), Dutch West Indian (57.2%, a difference of 0.36%), Immigrants from Nicaragua (57.6%, a difference of 0.39%), and Hopi (57.1%, a difference of 0.48%). Similarly, the demographic groups most similar to Puerto Ricans are Guatemalan (56.8%, a difference of 0.060%), Immigrants from Haiti (56.9%, a difference of 0.20%), Hispanic or Latino (57.0%, a difference of 0.32%), Native/Alaskan (56.6%, a difference of 0.32%), and Menominee (57.0%, a difference of 0.36%).
| Demographics | Rating | Rank | College, Under 1 year |
| Kiowa | 0.0 /100 | #304 | Tragic 57.8% |
| Haitians | 0.0 /100 | #305 | Tragic 57.8% |
| Immigrants | Portugal | 0.0 /100 | #306 | Tragic 57.7% |
| Fijians | 0.0 /100 | #307 | Tragic 57.7% |
| Central Americans | 0.0 /100 | #308 | Tragic 57.7% |
| Immigrants | Nicaragua | 0.0 /100 | #309 | Tragic 57.6% |
| Pueblo | 0.0 /100 | #310 | Tragic 57.4% |
| Cajuns | 0.0 /100 | #311 | Tragic 57.3% |
| Salvadorans | 0.0 /100 | #312 | Tragic 57.3% |
| Dutch West Indians | 0.0 /100 | #313 | Tragic 57.2% |
| Hopi | 0.0 /100 | #314 | Tragic 57.1% |
| Hondurans | 0.0 /100 | #315 | Tragic 57.1% |
| Menominee | 0.0 /100 | #316 | Tragic 57.0% |
| Hispanics or Latinos | 0.0 /100 | #317 | Tragic 57.0% |
| Immigrants | Haiti | 0.0 /100 | #318 | Tragic 56.9% |
| Puerto Ricans | 0.0 /100 | #319 | Tragic 56.8% |
| Guatemalans | 0.0 /100 | #320 | Tragic 56.8% |
| Natives/Alaskans | 0.0 /100 | #321 | Tragic 56.6% |
| Immigrants | Caribbean | 0.0 /100 | #322 | Tragic 56.6% |
| Immigrants | Honduras | 0.0 /100 | #323 | Tragic 56.5% |
| Immigrants | El Salvador | 0.0 /100 | #324 | Tragic 56.4% |