Pueblo vs Immigrants from Portugal Female Disability
COMPARE
Pueblo
Immigrants from Portugal
Female Disability
Female Disability Comparison
Pueblo
Immigrants from Portugal
14.1%
FEMALE DISABILITY
0.0/ 100
METRIC RATING
322nd/ 347
METRIC RANK
13.5%
FEMALE DISABILITY
0.0/ 100
METRIC RATING
303rd/ 347
METRIC RANK
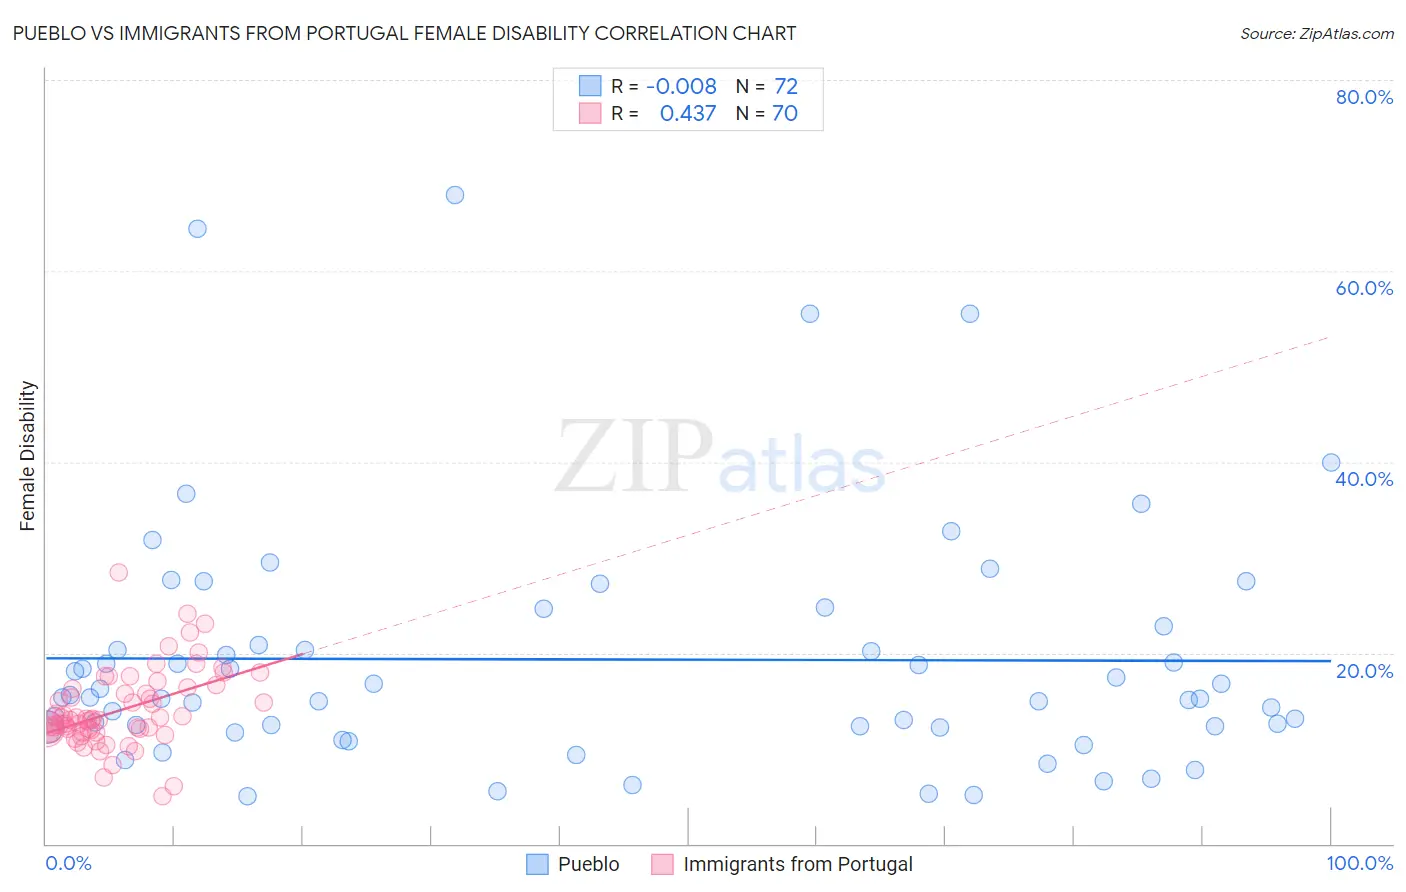
Pueblo vs Immigrants from Portugal Female Disability Correlation Chart
The statistical analysis conducted on geographies consisting of 120,072,777 people shows no correlation between the proportion of Pueblo and percentage of females with a disability in the United States with a correlation coefficient (R) of -0.008 and weighted average of 14.1%. Similarly, the statistical analysis conducted on geographies consisting of 174,785,293 people shows a moderate positive correlation between the proportion of Immigrants from Portugal and percentage of females with a disability in the United States with a correlation coefficient (R) of 0.437 and weighted average of 13.5%, a difference of 5.0%.
Female Disability Correlation Summary
| Measurement | Pueblo | Immigrants from Portugal |
| Minimum | 5.0% | 5.0% |
| Maximum | 67.9% | 28.4% |
| Range | 62.9% | 23.4% |
| Mean | 19.3% | 14.0% |
| Median | 15.4% | 12.9% |
| Interquartile 25% (IQ1) | 12.3% | 11.7% |
| Interquartile 75% (IQ3) | 21.8% | 16.3% |
| Interquartile Range (IQR) | 9.5% | 4.6% |
| Standard Deviation (Sample) | 12.9% | 4.1% |
| Standard Deviation (Population) | 12.8% | 4.0% |
Demographics Similar to Pueblo and Immigrants from Portugal by Female Disability
In terms of female disability, the demographic groups most similar to Pueblo are Potawatomi (14.1%, a difference of 0.010%), American (14.1%, a difference of 0.15%), Iroquois (14.0%, a difference of 0.49%), Paiute (14.0%, a difference of 0.77%), and Chippewa (14.0%, a difference of 0.89%). Similarly, the demographic groups most similar to Immigrants from Portugal are Scotch-Irish (13.4%, a difference of 0.0%), Immigrants from Micronesia (13.5%, a difference of 0.030%), Dominican (13.5%, a difference of 0.34%), French Canadian (13.6%, a difference of 0.98%), and Central American Indian (13.6%, a difference of 1.3%).
| Demographics | Rating | Rank | Female Disability |
| Scotch-Irish | 0.0 /100 | #302 | Tragic 13.4% |
| Immigrants | Portugal | 0.0 /100 | #303 | Tragic 13.5% |
| Immigrants | Micronesia | 0.0 /100 | #304 | Tragic 13.5% |
| Dominicans | 0.0 /100 | #305 | Tragic 13.5% |
| French Canadians | 0.0 /100 | #306 | Tragic 13.6% |
| Central American Indians | 0.0 /100 | #307 | Tragic 13.6% |
| Cree | 0.0 /100 | #308 | Tragic 13.7% |
| French American Indians | 0.0 /100 | #309 | Tragic 13.7% |
| Apache | 0.0 /100 | #310 | Tragic 13.7% |
| Hopi | 0.0 /100 | #311 | Tragic 13.7% |
| Delaware | 0.0 /100 | #312 | Tragic 13.8% |
| Blackfeet | 0.0 /100 | #313 | Tragic 13.8% |
| Puget Sound Salish | 0.0 /100 | #314 | Tragic 13.8% |
| Alaskan Athabascans | 0.0 /100 | #315 | Tragic 13.9% |
| Spanish Americans | 0.0 /100 | #316 | Tragic 14.0% |
| Chippewa | 0.0 /100 | #317 | Tragic 14.0% |
| Paiute | 0.0 /100 | #318 | Tragic 14.0% |
| Iroquois | 0.0 /100 | #319 | Tragic 14.0% |
| Americans | 0.0 /100 | #320 | Tragic 14.1% |
| Potawatomi | 0.0 /100 | #321 | Tragic 14.1% |
| Pueblo | 0.0 /100 | #322 | Tragic 14.1% |