Pueblo vs Colombian Female Disability
COMPARE
Pueblo
Colombian
Female Disability
Female Disability Comparison
Pueblo
Colombians
14.1%
FEMALE DISABILITY
0.0/ 100
METRIC RATING
322nd/ 347
METRIC RANK
11.5%
FEMALE DISABILITY
99.8/ 100
METRIC RATING
69th/ 347
METRIC RANK
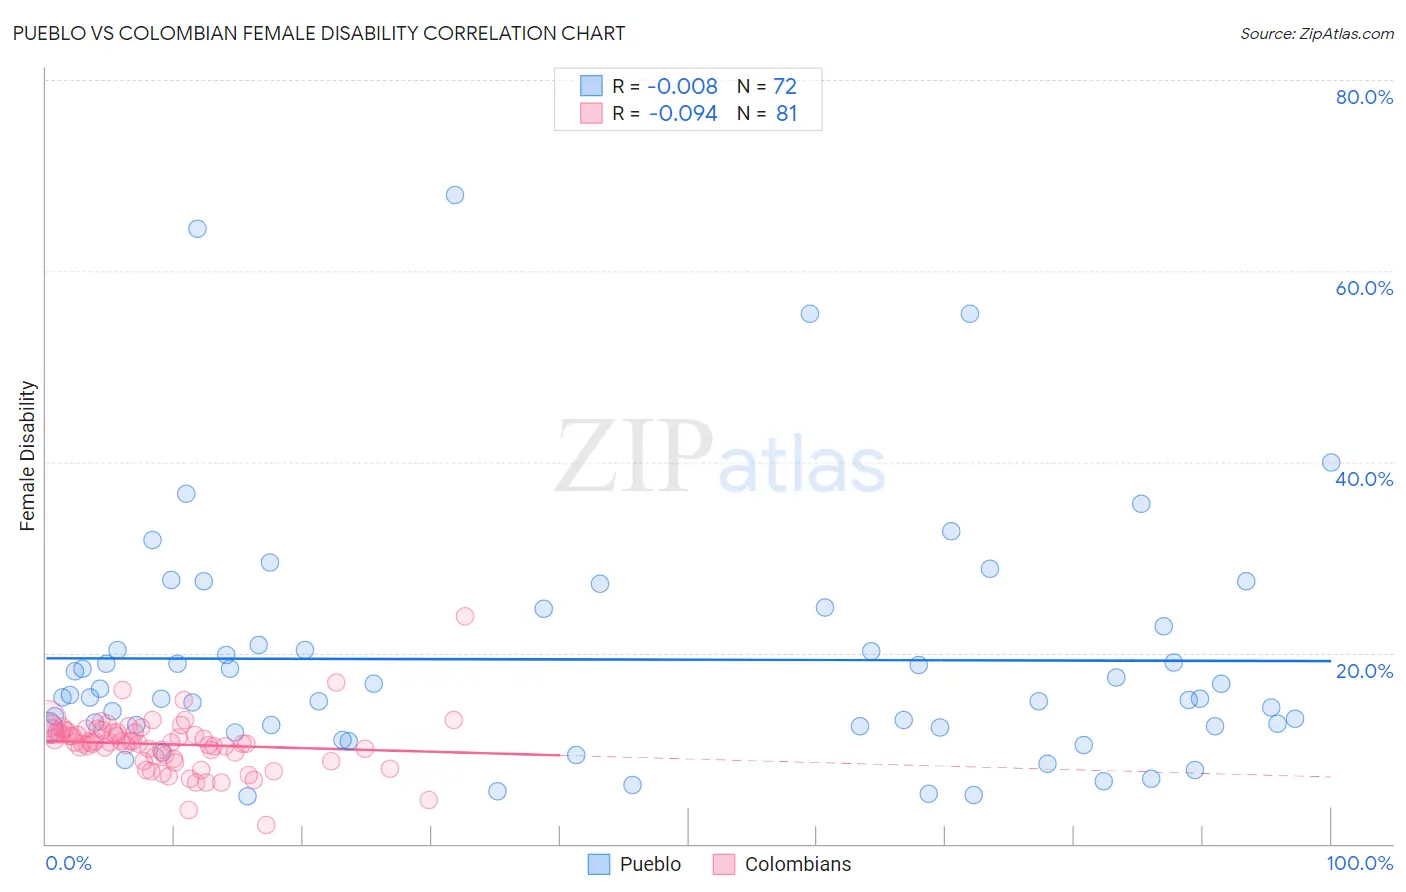
Pueblo vs Colombian Female Disability Correlation Chart
The statistical analysis conducted on geographies consisting of 120,072,777 people shows no correlation between the proportion of Pueblo and percentage of females with a disability in the United States with a correlation coefficient (R) of -0.008 and weighted average of 14.1%. Similarly, the statistical analysis conducted on geographies consisting of 419,587,687 people shows a slight negative correlation between the proportion of Colombians and percentage of females with a disability in the United States with a correlation coefficient (R) of -0.094 and weighted average of 11.5%, a difference of 23.0%.
Female Disability Correlation Summary
| Measurement | Pueblo | Colombian |
| Minimum | 5.0% | 1.9% |
| Maximum | 67.9% | 23.8% |
| Range | 62.9% | 21.9% |
| Mean | 19.3% | 10.4% |
| Median | 15.4% | 10.6% |
| Interquartile 25% (IQ1) | 12.3% | 9.0% |
| Interquartile 75% (IQ3) | 21.8% | 11.7% |
| Interquartile Range (IQR) | 9.5% | 2.7% |
| Standard Deviation (Sample) | 12.9% | 2.9% |
| Standard Deviation (Population) | 12.8% | 2.9% |
Similar Demographics by Female Disability
Demographics Similar to Pueblo by Female Disability
In terms of female disability, the demographic groups most similar to Pueblo are Potawatomi (14.1%, a difference of 0.010%), American (14.1%, a difference of 0.15%), Black/African American (14.1%, a difference of 0.17%), Native/Alaskan (14.1%, a difference of 0.18%), and Navajo (14.2%, a difference of 0.32%).
| Demographics | Rating | Rank | Female Disability |
| Alaskan Athabascans | 0.0 /100 | #315 | Tragic 13.9% |
| Spanish Americans | 0.0 /100 | #316 | Tragic 14.0% |
| Chippewa | 0.0 /100 | #317 | Tragic 14.0% |
| Paiute | 0.0 /100 | #318 | Tragic 14.0% |
| Iroquois | 0.0 /100 | #319 | Tragic 14.0% |
| Americans | 0.0 /100 | #320 | Tragic 14.1% |
| Potawatomi | 0.0 /100 | #321 | Tragic 14.1% |
| Pueblo | 0.0 /100 | #322 | Tragic 14.1% |
| Blacks/African Americans | 0.0 /100 | #323 | Tragic 14.1% |
| Natives/Alaskans | 0.0 /100 | #324 | Tragic 14.1% |
| Navajo | 0.0 /100 | #325 | Tragic 14.2% |
| Comanche | 0.0 /100 | #326 | Tragic 14.2% |
| Ottawa | 0.0 /100 | #327 | Tragic 14.2% |
| Cape Verdeans | 0.0 /100 | #328 | Tragic 14.2% |
| Osage | 0.0 /100 | #329 | Tragic 14.3% |
Demographics Similar to Colombians by Female Disability
In terms of female disability, the demographic groups most similar to Colombians are Immigrants from Chile (11.5%, a difference of 0.010%), Immigrants from Ireland (11.5%, a difference of 0.050%), Immigrants from Northern Africa (11.5%, a difference of 0.070%), Immigrants from Vietnam (11.5%, a difference of 0.090%), and Chilean (11.5%, a difference of 0.12%).
| Demographics | Rating | Rank | Female Disability |
| Sri Lankans | 99.9 /100 | #62 | Exceptional 11.4% |
| Immigrants | Colombia | 99.9 /100 | #63 | Exceptional 11.4% |
| Immigrants | El Salvador | 99.9 /100 | #64 | Exceptional 11.4% |
| Immigrants | South America | 99.9 /100 | #65 | Exceptional 11.4% |
| Salvadorans | 99.8 /100 | #66 | Exceptional 11.5% |
| Immigrants | Vietnam | 99.8 /100 | #67 | Exceptional 11.5% |
| Immigrants | Northern Africa | 99.8 /100 | #68 | Exceptional 11.5% |
| Colombians | 99.8 /100 | #69 | Exceptional 11.5% |
| Immigrants | Chile | 99.8 /100 | #70 | Exceptional 11.5% |
| Immigrants | Ireland | 99.8 /100 | #71 | Exceptional 11.5% |
| Chileans | 99.8 /100 | #72 | Exceptional 11.5% |
| Immigrants | Switzerland | 99.8 /100 | #73 | Exceptional 11.5% |
| Bhutanese | 99.8 /100 | #74 | Exceptional 11.5% |
| Immigrants | Lebanon | 99.7 /100 | #75 | Exceptional 11.5% |
| Immigrants | Eritrea | 99.7 /100 | #76 | Exceptional 11.5% |