Potawatomi vs Yugoslavian Married-couple Households
COMPARE
Potawatomi
Yugoslavian
Married-couple Households
Married-couple Households Comparison
Potawatomi
Yugoslavians
45.7%
MARRIED-COUPLE HOUSEHOLDS
15.6/ 100
METRIC RATING
200th/ 347
METRIC RANK
46.2%
MARRIED-COUPLE HOUSEHOLDS
38.9/ 100
METRIC RATING
182nd/ 347
METRIC RANK
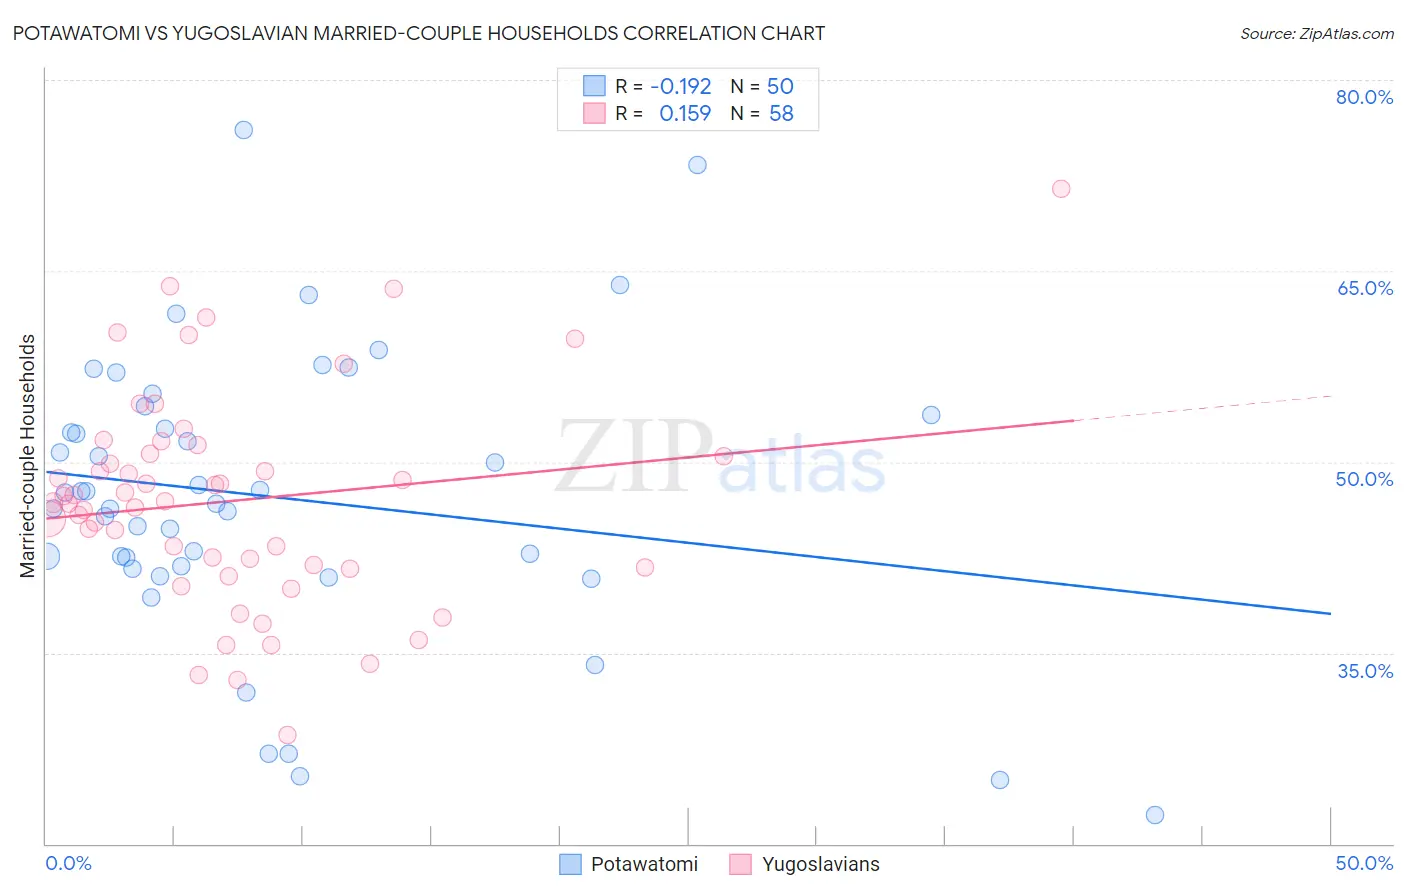
Potawatomi vs Yugoslavian Married-couple Households Correlation Chart
The statistical analysis conducted on geographies consisting of 117,759,864 people shows a poor negative correlation between the proportion of Potawatomi and percentage of married-couple family households in the United States with a correlation coefficient (R) of -0.192 and weighted average of 45.7%. Similarly, the statistical analysis conducted on geographies consisting of 285,634,197 people shows a poor positive correlation between the proportion of Yugoslavians and percentage of married-couple family households in the United States with a correlation coefficient (R) of 0.159 and weighted average of 46.2%, a difference of 1.2%.
Married-couple Households Correlation Summary
| Measurement | Potawatomi | Yugoslavian |
| Minimum | 22.2% | 28.5% |
| Maximum | 76.1% | 71.4% |
| Range | 53.9% | 42.9% |
| Mean | 47.2% | 47.0% |
| Median | 47.1% | 46.8% |
| Interquartile 25% (IQ1) | 41.8% | 41.7% |
| Interquartile 75% (IQ3) | 53.7% | 50.6% |
| Interquartile Range (IQR) | 11.9% | 9.0% |
| Standard Deviation (Sample) | 11.3% | 8.5% |
| Standard Deviation (Population) | 11.2% | 8.4% |
Demographics Similar to Potawatomi and Yugoslavians by Married-couple Households
In terms of married-couple households, the demographic groups most similar to Potawatomi are Carpatho Rusyn (45.7%, a difference of 0.010%), Immigrants from Serbia (45.7%, a difference of 0.030%), Ottawa (45.8%, a difference of 0.25%), Cambodian (45.9%, a difference of 0.36%), and Immigrants from South America (45.9%, a difference of 0.42%). Similarly, the demographic groups most similar to Yugoslavians are Immigrants from Brazil (46.2%, a difference of 0.020%), Immigrants from Switzerland (46.2%, a difference of 0.080%), Malaysian (46.3%, a difference of 0.12%), Brazilian (46.2%, a difference of 0.12%), and Albanian (46.1%, a difference of 0.32%).
| Demographics | Rating | Rank | Married-couple Households |
| Malaysians | 41.8 /100 | #181 | Average 46.3% |
| Yugoslavians | 38.9 /100 | #182 | Fair 46.2% |
| Immigrants | Brazil | 38.3 /100 | #183 | Fair 46.2% |
| Immigrants | Switzerland | 36.9 /100 | #184 | Fair 46.2% |
| Brazilians | 35.9 /100 | #185 | Fair 46.2% |
| Albanians | 31.1 /100 | #186 | Fair 46.1% |
| Fijians | 29.2 /100 | #187 | Fair 46.1% |
| South American Indians | 28.4 /100 | #188 | Fair 46.0% |
| Immigrants | Latvia | 26.9 /100 | #189 | Fair 46.0% |
| Immigrants | Kuwait | 25.6 /100 | #190 | Fair 46.0% |
| Choctaw | 24.9 /100 | #191 | Fair 46.0% |
| Immigrants | Northern Africa | 24.6 /100 | #192 | Fair 46.0% |
| Taiwanese | 23.4 /100 | #193 | Fair 45.9% |
| Mexican American Indians | 23.3 /100 | #194 | Fair 45.9% |
| Chickasaw | 22.7 /100 | #195 | Fair 45.9% |
| Immigrants | South America | 22.2 /100 | #196 | Fair 45.9% |
| Cambodians | 21.3 /100 | #197 | Fair 45.9% |
| Ottawa | 19.4 /100 | #198 | Poor 45.8% |
| Carpatho Rusyns | 15.7 /100 | #199 | Poor 45.7% |
| Potawatomi | 15.6 /100 | #200 | Poor 45.7% |
| Immigrants | Serbia | 15.2 /100 | #201 | Poor 45.7% |