Potawatomi vs Immigrants from Latvia Unemployment

COMPARE

Potawatomi
Race
Ancestry
AfghanAfricanAlaska NativeAlaskan AthabascanAlbanianAleutAlsatianAmericanApacheArabArapahoArgentineanArmenianAssyrian/Chaldean/SyriacAustralianAustrianBahamianBangladeshiBarbadianBasqueBelgianBelizeanBermudanBhutaneseBlackfeetBolivianBrazilianBritishBritish West IndianBulgarianBurmeseCajunCambodianCanadianCape VerdeanCarpatho RusynCelticCentral AmericanCentral American IndianCherokeeCheyenneChickasawChileanChineseChippewaChoctawColombianColvilleComancheCosta RicanCreeCreekCroatianCrowCubanCypriotCzechCzechoslovakianDanishDelawareDominicanDutchDutch West IndianEastern EuropeanEcuadorianEgyptianEnglishEstonianEthiopianEuropeanFijianFilipinoFinnishFrenchFrench American IndianFrench CanadianGermanGerman RussianGhanaianGreekGuamanian/ChamorroGuatemalanGuyaneseHaitianHmongHonduranHopiHoumaHungarianIcelanderIndian (Asian)IndonesianInupiatIranianIraqiIrishIroquoisIsraeliItalianJamaicanJapaneseJordanianKenyanKiowaKoreanLaotianLatvianLebaneseLiberianLithuanianLumbeeLuxembourgerMacedonianMalaysianMalteseMarshalleseMenomineeMexicanMexican American IndianMongolianMoroccanNative HawaiianNavajoNepaleseNew ZealanderNicaraguanNigerianNorthern EuropeanNorwegianOkinawanOsageOttawaPaiutePakistaniPalestinianPanamanianParaguayanPennsylvania GermanPeruvianPimaPolishPortuguesePotawatomiPuebloPuerto RicanPuget Sound SalishRomanianRussianSalvadoranSamoanScandinavianScotch-IrishScottishSeminoleSenegaleseSerbianShoshoneSierra LeoneanSiouxSlavicSlovakSloveneSomaliSouth AfricanSouth AmericanSouth American IndianSoviet UnionSpaniardSpanishSpanish AmericanSpanish American IndianSri LankanSubsaharan AfricanSudaneseSwedishSwissSyrianTaiwaneseThaiTlingit-HaidaTohono O'OdhamTonganTrinidadian and TobagonianTsimshianTurkishU.S. Virgin IslanderUgandanUkrainianUruguayanUteVenezuelanVietnameseWelshWest IndianYakamaYaquiYugoslavianYumanYup'ikZimbabwean
Immigration
NonimmigrantsImmigrantsAfghanistanAfricaAlbaniaArgentinaArmeniaAsiaAustraliaAustriaBahamasBangladeshBarbadosBelarusBelgiumBelizeBoliviaBosnia and HerzegovinaBrazilBulgariaBurma/MyanmarCabo VerdeCambodiaCameroonCanadaCaribbeanCentral AmericaChileChinaColombiaCongoCosta RicaCroatiaCubaCzechoslovakiaDenmarkDominicaDominican RepublicEastern AfricaEastern AsiaEastern EuropeEcuadorEgyptEl SalvadorEnglandEritreaEthiopiaEuropeFijiFranceGermanyGhanaGreeceGrenadaGuatemalaGuyanaHaitiHondurasHong KongHungaryIndiaIndonesiaIranIraqIrelandIsraelItalyJamaicaJapanJordanKazakhstanKenyaKoreaKuwaitLaosLatin AmericaLebanonLiberiaLithuaniaMalaysiaMexicoMicronesiaMiddle AfricaMoldovaMoroccoNepalNetherlandsNicaraguaNigeriaNorth AmericaNorth MacedoniaNorthern AfricaNorthern EuropeNorwayOceaniaPakistanPanamaPeruPhilippinesPolandPortugalRomaniaRussiaSaudi ArabiaScotlandSenegalSerbiaSierra LeoneSingaporeSomaliaSouth AfricaSouth AmericaSouth Central AsiaSouth Eastern AsiaSouthern EuropeSpainSri LankaSt. Vincent and the GrenadinesSudanSwedenSwitzerlandSyriaTaiwanThailandTrinidad and TobagoTurkeyUgandaUkraineUruguayUzbekistanVenezuelaVietnamWest IndiesWestern AfricaWestern AsiaWestern EuropeYemenZaireZimbabweAzores
Immigrants from Latvia
Race
Ancestry
AfghanAfricanAlaska NativeAlaskan AthabascanAlbanianAleutAlsatianAmericanApacheArabArapahoArgentineanArmenianAssyrian/Chaldean/SyriacAustralianAustrianBahamianBangladeshiBarbadianBasqueBelgianBelizeanBermudanBhutaneseBlackfeetBolivianBrazilianBritishBritish West IndianBulgarianBurmeseCajunCambodianCanadianCape VerdeanCarpatho RusynCelticCentral AmericanCentral American IndianCherokeeCheyenneChickasawChileanChineseChippewaChoctawColombianColvilleComancheCosta RicanCreeCreekCroatianCrowCubanCypriotCzechCzechoslovakianDanishDelawareDominicanDutchDutch West IndianEastern EuropeanEcuadorianEgyptianEnglishEstonianEthiopianEuropeanFijianFilipinoFinnishFrenchFrench American IndianFrench CanadianGermanGerman RussianGhanaianGreekGuamanian/ChamorroGuatemalanGuyaneseHaitianHmongHonduranHopiHoumaHungarianIcelanderIndian (Asian)IndonesianInupiatIranianIraqiIrishIroquoisIsraeliItalianJamaicanJapaneseJordanianKenyanKiowaKoreanLaotianLatvianLebaneseLiberianLithuanianLumbeeLuxembourgerMacedonianMalaysianMalteseMarshalleseMenomineeMexicanMexican American IndianMongolianMoroccanNative HawaiianNavajoNepaleseNew ZealanderNicaraguanNigerianNorthern EuropeanNorwegianOkinawanOsageOttawaPaiutePakistaniPalestinianPanamanianParaguayanPennsylvania GermanPeruvianPimaPolishPortuguesePuebloPuerto RicanPuget Sound SalishRomanianRussianSalvadoranSamoanScandinavianScotch-IrishScottishSeminoleSenegaleseSerbianShoshoneSierra LeoneanSiouxSlavicSlovakSloveneSomaliSouth AfricanSouth AmericanSouth American IndianSoviet UnionSpaniardSpanishSpanish AmericanSpanish American IndianSri LankanSubsaharan AfricanSudaneseSwedishSwissSyrianTaiwaneseThaiTlingit-HaidaTohono O'OdhamTonganTrinidadian and TobagonianTsimshianTurkishU.S. Virgin IslanderUgandanUkrainianUruguayanUteVenezuelanVietnameseWelshWest IndianYakamaYaquiYugoslavianYumanYup'ikZimbabwean
Immigration
NonimmigrantsImmigrantsAfghanistanAfricaAlbaniaArgentinaArmeniaAsiaAustraliaAustriaBahamasBangladeshBarbadosBelarusBelgiumBelizeBoliviaBosnia and HerzegovinaBrazilBulgariaBurma/MyanmarCabo VerdeCambodiaCameroonCanadaCaribbeanCentral AmericaChileChinaColombiaCongoCosta RicaCroatiaCubaCzechoslovakiaDenmarkDominicaDominican RepublicEastern AfricaEastern AsiaEastern EuropeEcuadorEgyptEl SalvadorEnglandEritreaEthiopiaEuropeFijiFranceGermanyGhanaGreeceGrenadaGuatemalaGuyanaHaitiHondurasHong KongHungaryIndiaIndonesiaIranIraqIrelandIsraelItalyJamaicaJapanJordanKazakhstanKenyaKoreaKuwaitLaosLatin AmericaLatviaLebanonLiberiaLithuaniaMalaysiaMexicoMicronesiaMiddle AfricaMoldovaMoroccoNepalNetherlandsNicaraguaNigeriaNorth AmericaNorth MacedoniaNorthern AfricaNorthern EuropeNorwayOceaniaPakistanPanamaPeruPhilippinesPolandPortugalRomaniaRussiaSaudi ArabiaScotlandSenegalSerbiaSierra LeoneSingaporeSomaliaSouth AfricaSouth AmericaSouth Central AsiaSouth Eastern AsiaSouthern EuropeSpainSri LankaSt. Vincent and the GrenadinesSudanSwedenSwitzerlandSyriaTaiwanThailandTrinidad and TobagoTurkeyUgandaUkraineUruguayUzbekistanVenezuelaVietnamWest IndiesWestern AfricaWestern AsiaWestern EuropeYemenZaireZimbabweAzores
Unemployment
Income
Poverty
Unemployment
Labor Participation
Family Structure
Vehicle Availability
Education Level
Disability

Unemployment Comparison

Potawatomi

Immigrants from Latvia

Good
Excellent
5.2%
UNEMPLOYMENT
76.2/ 100
METRIC RATING
150th/ 347
METRIC RANK
5.1%
UNEMPLOYMENT
88.0/ 100
METRIC RATING
129th/ 347
METRIC RANK

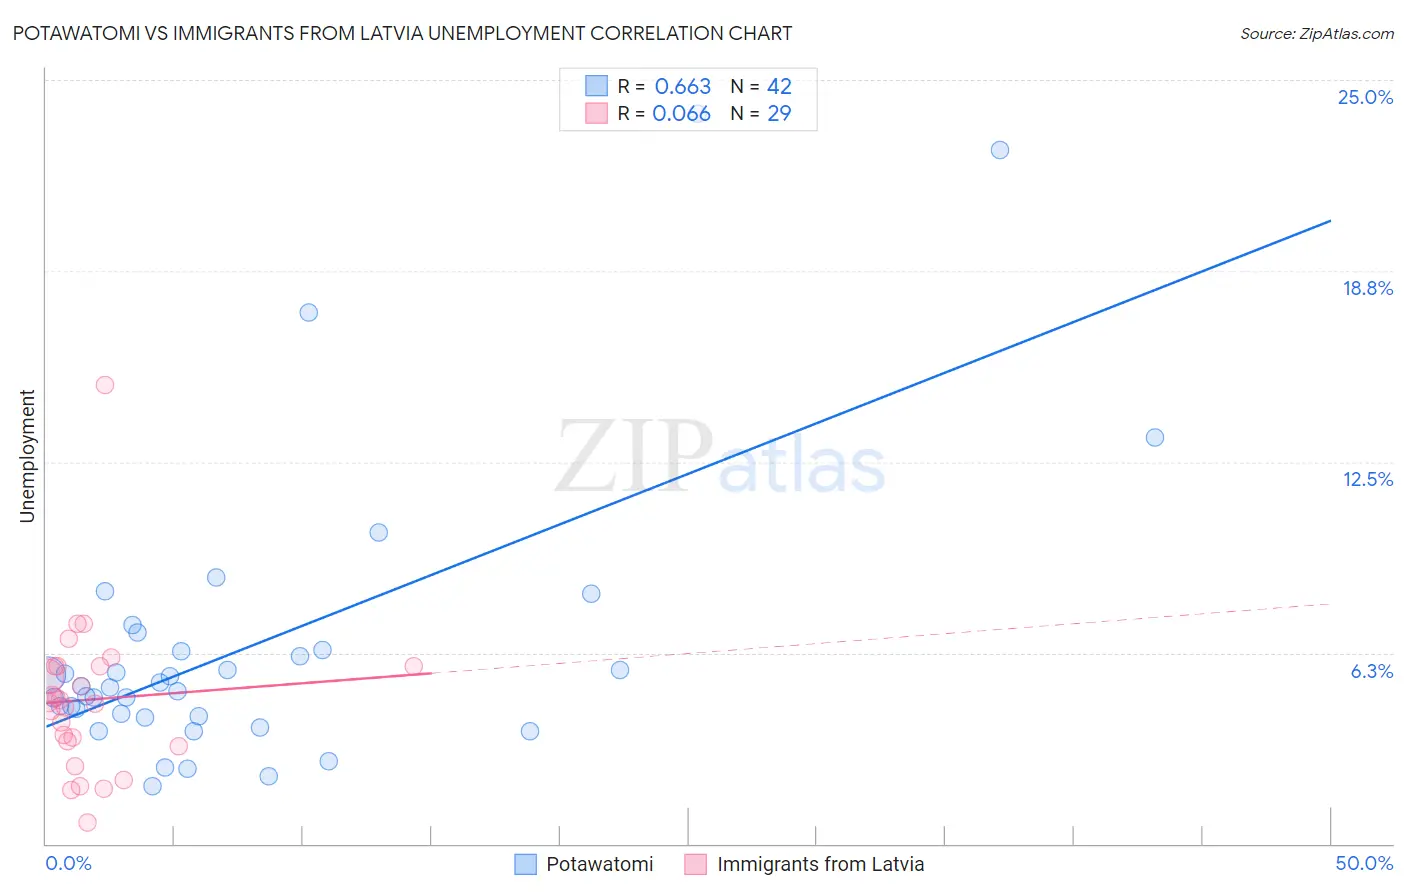
Potawatomi vs Immigrants from Latvia Unemployment Correlation Chart

The statistical analysis conducted on geographies consisting of 117,685,766 people shows a significant positive correlation between the proportion of Potawatomi and unemployment in the United States with a correlation coefficient (R) of 0.663 and weighted average of 5.2%. Similarly, the statistical analysis conducted on geographies consisting of 113,721,061 people shows a slight positive correlation between the proportion of Immigrants from Latvia and unemployment in the United States with a correlation coefficient (R) of 0.066 and weighted average of 5.1%, a difference of 1.3%.
Potawatomi vs Immigrants from Latvia Unemployment

Unemployment Correlation Summary

MeasurementPotawatomiImmigrants from Latvia
Minimum1.9%0.70%
Maximum23.9%15.0%
Range22.0%14.3%
Mean6.5%4.7%
Median5.2%4.6%
Interquartile 25% (IQ1)4.2%3.3%
Interquartile 75% (IQ3)6.4%5.8%
Interquartile Range (IQR)2.2%2.5%
Standard Deviation (Sample)4.8%2.6%
Standard Deviation (Population)4.7%2.6%

Similar Demographics by Unemployment

Demographics Similar to Potawatomi by Unemployment

In terms of unemployment, the demographic groups most similar to Potawatomi are Immigrants from Eastern Europe (5.2%, a difference of 0.070%), Immigrants from Hong Kong (5.2%, a difference of 0.080%), Egyptian (5.2%, a difference of 0.080%), Immigrants from China (5.2%, a difference of 0.12%), and Syrian (5.2%, a difference of 0.14%).
DemographicsRating | RankUnemployment
Immigrants | Chile
82.8
/100
|
#143
Excellent
5.1%
Indonesians
82.3
/100
|
#144
Excellent
5.1%
Immigrants | Norway
81.8
/100
|
#145
Excellent
5.1%
Immigrants | Asia
81.8
/100
|
#146
Excellent
5.1%
Indians (Asian)
81.6
/100
|
#147
Excellent
5.1%
Immigrants | Italy
79.1
/100
|
#148
Good
5.1%
Syrians
77.7
/100
|
#149
Good
5.2%
Potawatomi
76.2
/100
|
#150
Good
5.2%
Immigrants | Eastern Europe
75.3
/100
|
#151
Good
5.2%
Immigrants | Hong Kong
75.2
/100
|
#152
Good
5.2%
Egyptians
75.2
/100
|
#153
Good
5.2%
Immigrants | China
74.7
/100
|
#154
Good
5.2%
Immigrants | Northern Africa
71.3
/100
|
#155
Good
5.2%
Immigrants | Kazakhstan
70.4
/100
|
#156
Good
5.2%
Sri Lankans
69.5
/100
|
#157
Good
5.2%

Demographics Similar to Immigrants from Latvia by Unemployment

In terms of unemployment, the demographic groups most similar to Immigrants from Latvia are Immigrants from Eastern Africa (5.1%, a difference of 0.0%), Kenyan (5.1%, a difference of 0.020%), Immigrants from Kenya (5.1%, a difference of 0.020%), Immigrants from Eastern Asia (5.1%, a difference of 0.040%), and Ethiopian (5.1%, a difference of 0.090%).
DemographicsRating | RankUnemployment
Immigrants | Switzerland
89.1
/100
|
#122
Excellent
5.1%
Asians
89.0
/100
|
#123
Excellent
5.1%
Ethiopians
88.6
/100
|
#124
Excellent
5.1%
Immigrants | Eastern Asia
88.3
/100
|
#125
Excellent
5.1%
Kenyans
88.2
/100
|
#126
Excellent
5.1%
Immigrants | Kenya
88.2
/100
|
#127
Excellent
5.1%
Immigrants | Eastern Africa
88.1
/100
|
#128
Excellent
5.1%
Immigrants | Latvia
88.0
/100
|
#129
Excellent
5.1%
Iranians
86.9
/100
|
#130
Excellent
5.1%
Immigrants | Croatia
86.8
/100
|
#131
Excellent
5.1%
Immigrants | Ethiopia
86.7
/100
|
#132
Excellent
5.1%
Immigrants | Jordan
86.6
/100
|
#133
Excellent
5.1%
Immigrants | Europe
86.3
/100
|
#134
Excellent
5.1%
Immigrants | Burma/Myanmar
86.2
/100
|
#135
Excellent
5.1%
Immigrants | Spain
86.2
/100
|
#136
Excellent
5.1%