Potawatomi vs Soviet Union Ambulatory Disability
COMPARE
Potawatomi
Soviet Union
Ambulatory Disability
Ambulatory Disability Comparison
Potawatomi
Soviet Union
7.3%
AMBULATORY DISABILITY
0.0/ 100
METRIC RATING
320th/ 347
METRIC RANK
5.8%
AMBULATORY DISABILITY
98.9/ 100
METRIC RATING
88th/ 347
METRIC RANK
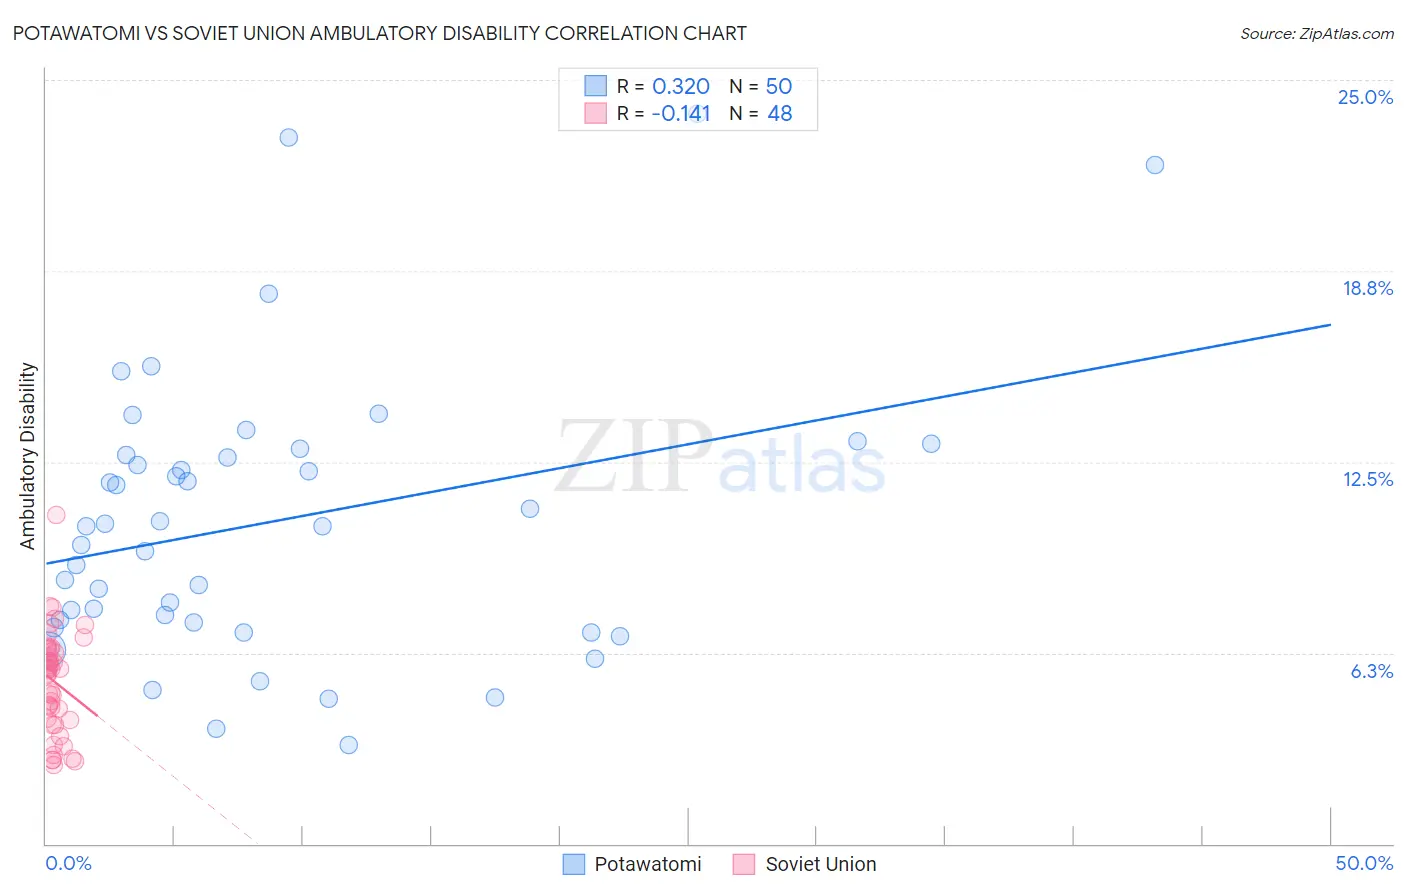
Potawatomi vs Soviet Union Ambulatory Disability Correlation Chart
The statistical analysis conducted on geographies consisting of 117,764,729 people shows a mild positive correlation between the proportion of Potawatomi and percentage of population with ambulatory disability in the United States with a correlation coefficient (R) of 0.320 and weighted average of 7.3%. Similarly, the statistical analysis conducted on geographies consisting of 43,487,843 people shows a poor negative correlation between the proportion of Soviet Union and percentage of population with ambulatory disability in the United States with a correlation coefficient (R) of -0.141 and weighted average of 5.8%, a difference of 27.2%.
Ambulatory Disability Correlation Summary
| Measurement | Potawatomi | Soviet Union |
| Minimum | 3.3% | 2.6% |
| Maximum | 23.9% | 10.8% |
| Range | 20.7% | 8.2% |
| Mean | 10.6% | 5.3% |
| Median | 10.4% | 5.7% |
| Interquartile 25% (IQ1) | 7.2% | 4.1% |
| Interquartile 75% (IQ3) | 12.7% | 6.3% |
| Interquartile Range (IQR) | 5.5% | 2.3% |
| Standard Deviation (Sample) | 4.6% | 1.7% |
| Standard Deviation (Population) | 4.6% | 1.6% |
Similar Demographics by Ambulatory Disability
Demographics Similar to Potawatomi by Ambulatory Disability
In terms of ambulatory disability, the demographic groups most similar to Potawatomi are Apache (7.4%, a difference of 0.81%), Osage (7.4%, a difference of 0.95%), American (7.4%, a difference of 1.2%), Dominican (7.2%, a difference of 1.9%), and Ottawa (7.2%, a difference of 2.2%).
| Demographics | Rating | Rank | Ambulatory Disability |
| Immigrants | Yemen | 0.0 /100 | #313 | Tragic 7.1% |
| Blackfeet | 0.0 /100 | #314 | Tragic 7.1% |
| Shoshone | 0.0 /100 | #315 | Tragic 7.1% |
| Immigrants | Dominican Republic | 0.0 /100 | #316 | Tragic 7.1% |
| Central American Indians | 0.0 /100 | #317 | Tragic 7.2% |
| Ottawa | 0.0 /100 | #318 | Tragic 7.2% |
| Dominicans | 0.0 /100 | #319 | Tragic 7.2% |
| Potawatomi | 0.0 /100 | #320 | Tragic 7.3% |
| Apache | 0.0 /100 | #321 | Tragic 7.4% |
| Osage | 0.0 /100 | #322 | Tragic 7.4% |
| Americans | 0.0 /100 | #323 | Tragic 7.4% |
| Navajo | 0.0 /100 | #324 | Tragic 7.5% |
| Comanche | 0.0 /100 | #325 | Tragic 7.5% |
| Blacks/African Americans | 0.0 /100 | #326 | Tragic 7.5% |
| Natives/Alaskans | 0.0 /100 | #327 | Tragic 7.5% |
Demographics Similar to Soviet Union by Ambulatory Disability
In terms of ambulatory disability, the demographic groups most similar to Soviet Union are Immigrants from Chile (5.8%, a difference of 0.040%), Latvian (5.7%, a difference of 0.11%), Bhutanese (5.8%, a difference of 0.12%), Australian (5.8%, a difference of 0.12%), and Immigrants from Sudan (5.8%, a difference of 0.12%).
| Demographics | Rating | Rank | Ambulatory Disability |
| Immigrants | Jordan | 99.2 /100 | #81 | Exceptional 5.7% |
| Palestinians | 99.2 /100 | #82 | Exceptional 5.7% |
| Eastern Europeans | 99.2 /100 | #83 | Exceptional 5.7% |
| Ugandans | 99.2 /100 | #84 | Exceptional 5.7% |
| South Americans | 99.0 /100 | #85 | Exceptional 5.7% |
| Latvians | 99.0 /100 | #86 | Exceptional 5.7% |
| Immigrants | Chile | 98.9 /100 | #87 | Exceptional 5.8% |
| Soviet Union | 98.9 /100 | #88 | Exceptional 5.8% |
| Bhutanese | 98.8 /100 | #89 | Exceptional 5.8% |
| Australians | 98.8 /100 | #90 | Exceptional 5.8% |
| Immigrants | Sudan | 98.8 /100 | #91 | Exceptional 5.8% |
| Immigrants | Sierra Leone | 98.6 /100 | #92 | Exceptional 5.8% |
| Immigrants | Denmark | 98.6 /100 | #93 | Exceptional 5.8% |
| Kenyans | 98.4 /100 | #94 | Exceptional 5.8% |
| Immigrants | El Salvador | 98.4 /100 | #95 | Exceptional 5.8% |