Potawatomi vs German Russian Ambulatory Disability
COMPARE
Potawatomi
German Russian
Ambulatory Disability
Ambulatory Disability Comparison
Potawatomi
German Russians
7.3%
AMBULATORY DISABILITY
0.0/ 100
METRIC RATING
320th/ 347
METRIC RANK
6.3%
AMBULATORY DISABILITY
9.4/ 100
METRIC RATING
222nd/ 347
METRIC RANK
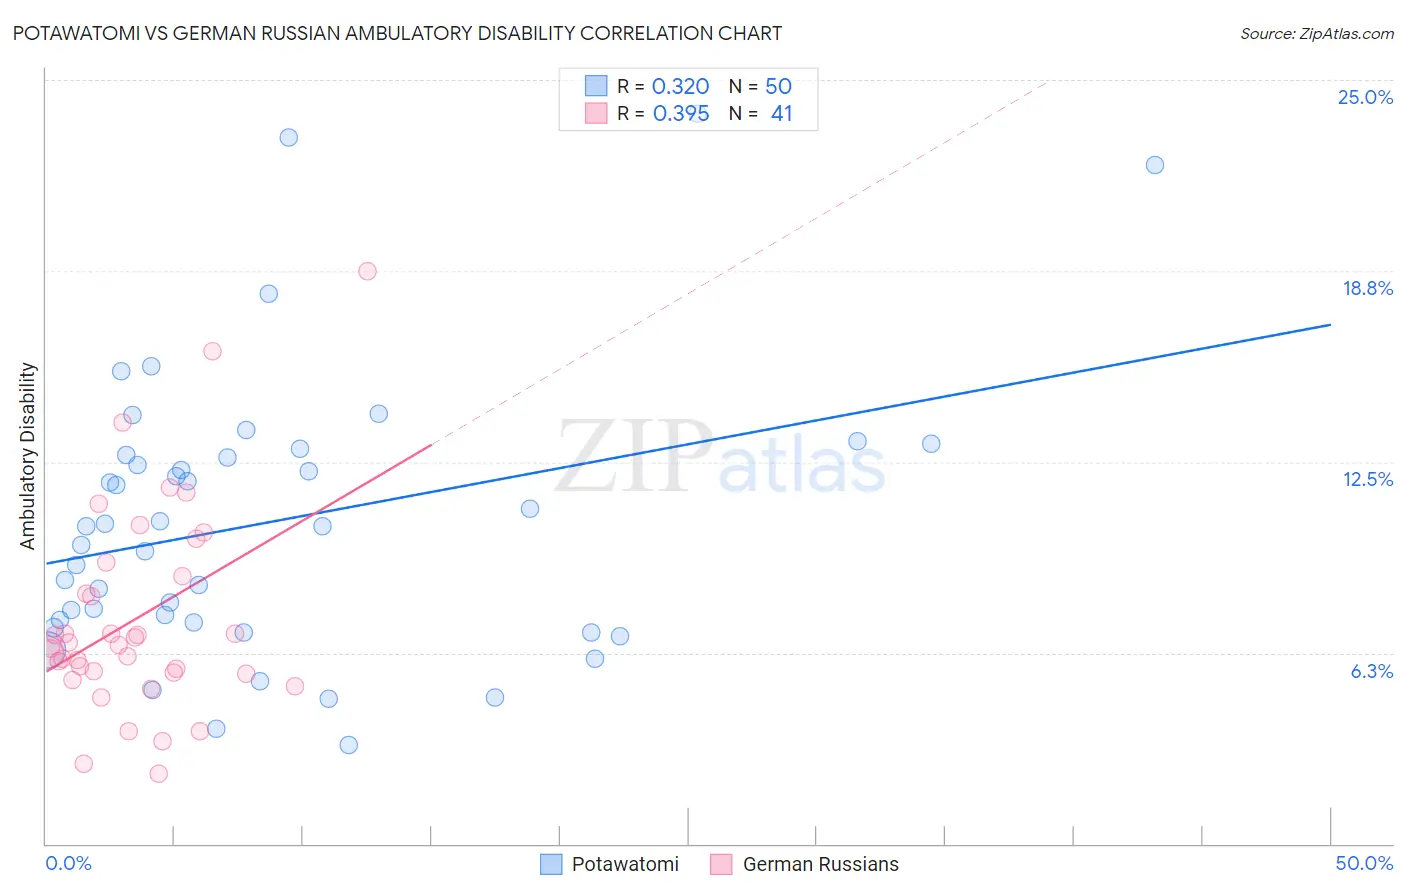
Potawatomi vs German Russian Ambulatory Disability Correlation Chart
The statistical analysis conducted on geographies consisting of 117,764,729 people shows a mild positive correlation between the proportion of Potawatomi and percentage of population with ambulatory disability in the United States with a correlation coefficient (R) of 0.320 and weighted average of 7.3%. Similarly, the statistical analysis conducted on geographies consisting of 96,455,793 people shows a mild positive correlation between the proportion of German Russians and percentage of population with ambulatory disability in the United States with a correlation coefficient (R) of 0.395 and weighted average of 6.3%, a difference of 16.2%.
Ambulatory Disability Correlation Summary
| Measurement | Potawatomi | German Russian |
| Minimum | 3.3% | 2.3% |
| Maximum | 23.9% | 18.8% |
| Range | 20.7% | 16.5% |
| Mean | 10.6% | 7.4% |
| Median | 10.4% | 6.5% |
| Interquartile 25% (IQ1) | 7.2% | 5.6% |
| Interquartile 75% (IQ3) | 12.7% | 9.0% |
| Interquartile Range (IQR) | 5.5% | 3.4% |
| Standard Deviation (Sample) | 4.6% | 3.4% |
| Standard Deviation (Population) | 4.6% | 3.4% |
Similar Demographics by Ambulatory Disability
Demographics Similar to Potawatomi by Ambulatory Disability
In terms of ambulatory disability, the demographic groups most similar to Potawatomi are Apache (7.4%, a difference of 0.81%), Osage (7.4%, a difference of 0.95%), American (7.4%, a difference of 1.2%), Dominican (7.2%, a difference of 1.9%), and Ottawa (7.2%, a difference of 2.2%).
| Demographics | Rating | Rank | Ambulatory Disability |
| Immigrants | Yemen | 0.0 /100 | #313 | Tragic 7.1% |
| Blackfeet | 0.0 /100 | #314 | Tragic 7.1% |
| Shoshone | 0.0 /100 | #315 | Tragic 7.1% |
| Immigrants | Dominican Republic | 0.0 /100 | #316 | Tragic 7.1% |
| Central American Indians | 0.0 /100 | #317 | Tragic 7.2% |
| Ottawa | 0.0 /100 | #318 | Tragic 7.2% |
| Dominicans | 0.0 /100 | #319 | Tragic 7.2% |
| Potawatomi | 0.0 /100 | #320 | Tragic 7.3% |
| Apache | 0.0 /100 | #321 | Tragic 7.4% |
| Osage | 0.0 /100 | #322 | Tragic 7.4% |
| Americans | 0.0 /100 | #323 | Tragic 7.4% |
| Navajo | 0.0 /100 | #324 | Tragic 7.5% |
| Comanche | 0.0 /100 | #325 | Tragic 7.5% |
| Blacks/African Americans | 0.0 /100 | #326 | Tragic 7.5% |
| Natives/Alaskans | 0.0 /100 | #327 | Tragic 7.5% |
Demographics Similar to German Russians by Ambulatory Disability
In terms of ambulatory disability, the demographic groups most similar to German Russians are Immigrants from Albania (6.3%, a difference of 0.030%), Hungarian (6.3%, a difference of 0.030%), Indonesian (6.3%, a difference of 0.070%), Guamanian/Chamorro (6.3%, a difference of 0.17%), and Canadian (6.3%, a difference of 0.21%).
| Demographics | Rating | Rank | Ambulatory Disability |
| Immigrants | Latin America | 11.0 /100 | #215 | Poor 6.3% |
| Canadians | 10.9 /100 | #216 | Poor 6.3% |
| Yugoslavians | 10.9 /100 | #217 | Poor 6.3% |
| Guamanians/Chamorros | 10.6 /100 | #218 | Poor 6.3% |
| Indonesians | 9.9 /100 | #219 | Tragic 6.3% |
| Immigrants | Albania | 9.6 /100 | #220 | Tragic 6.3% |
| Hungarians | 9.6 /100 | #221 | Tragic 6.3% |
| German Russians | 9.4 /100 | #222 | Tragic 6.3% |
| Immigrants | Honduras | 7.6 /100 | #223 | Tragic 6.3% |
| Liberians | 7.1 /100 | #224 | Tragic 6.3% |
| Hondurans | 6.3 /100 | #225 | Tragic 6.3% |
| Slavs | 5.1 /100 | #226 | Tragic 6.4% |
| Cubans | 4.0 /100 | #227 | Tragic 6.4% |
| Portuguese | 4.0 /100 | #228 | Tragic 6.4% |
| Czechoslovakians | 3.8 /100 | #229 | Tragic 6.4% |