Potawatomi vs Immigrants from Australia In Labor Force | Age 45-54
COMPARE
Potawatomi
Immigrants from Australia
In Labor Force | Age 45-54
In Labor Force | Age 45-54 Comparison
Potawatomi
Immigrants from Australia
80.0%
IN LABOR FORCE | AGE 45-54
0.0/ 100
METRIC RATING
309th/ 347
METRIC RANK
82.9%
IN LABOR FORCE | AGE 45-54
68.2/ 100
METRIC RATING
157th/ 347
METRIC RANK
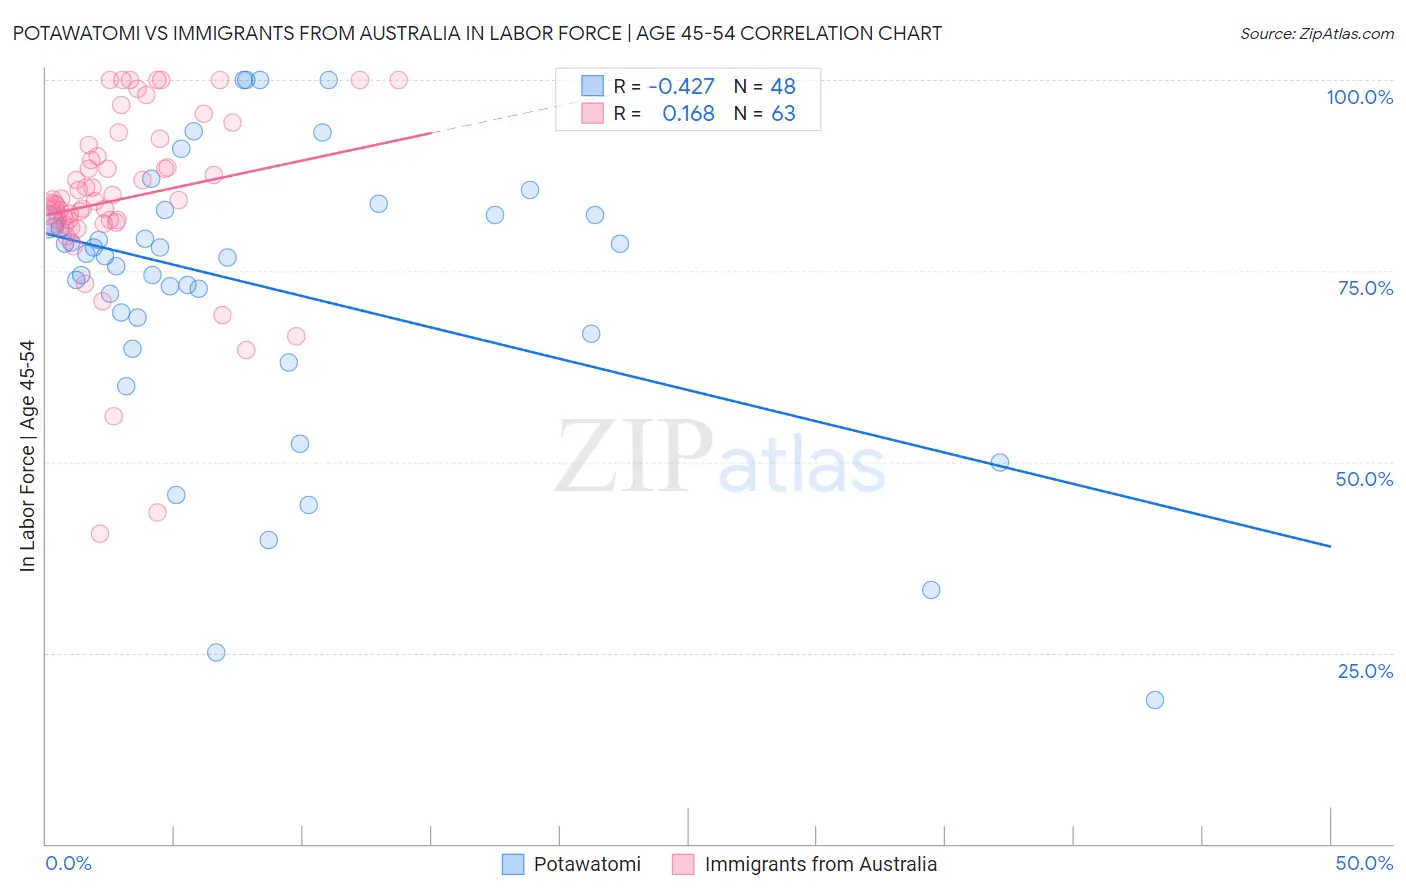
Potawatomi vs Immigrants from Australia In Labor Force | Age 45-54 Correlation Chart
The statistical analysis conducted on geographies consisting of 117,759,317 people shows a moderate negative correlation between the proportion of Potawatomi and labor force participation rate among population between the ages 45 and 54 in the United States with a correlation coefficient (R) of -0.427 and weighted average of 80.0%. Similarly, the statistical analysis conducted on geographies consisting of 227,126,379 people shows a poor positive correlation between the proportion of Immigrants from Australia and labor force participation rate among population between the ages 45 and 54 in the United States with a correlation coefficient (R) of 0.168 and weighted average of 82.9%, a difference of 3.7%.
In Labor Force | Age 45-54 Correlation Summary
| Measurement | Potawatomi | Immigrants from Australia |
| Minimum | 18.8% | 40.6% |
| Maximum | 100.0% | 100.0% |
| Range | 81.2% | 59.4% |
| Mean | 72.9% | 84.5% |
| Median | 77.1% | 84.2% |
| Interquartile 25% (IQ1) | 67.9% | 81.6% |
| Interquartile 75% (IQ3) | 82.4% | 91.5% |
| Interquartile Range (IQR) | 14.5% | 9.9% |
| Standard Deviation (Sample) | 18.5% | 12.0% |
| Standard Deviation (Population) | 18.3% | 11.9% |
Similar Demographics by In Labor Force | Age 45-54
Demographics Similar to Potawatomi by In Labor Force | Age 45-54
In terms of in labor force | age 45-54, the demographic groups most similar to Potawatomi are Central American Indian (80.0%, a difference of 0.030%), Blackfeet (80.0%, a difference of 0.070%), Inupiat (79.9%, a difference of 0.090%), Spanish American (80.1%, a difference of 0.14%), and Immigrants from Dominican Republic (80.1%, a difference of 0.18%).
| Demographics | Rating | Rank | In Labor Force | Age 45-54 |
| Immigrants | Central America | 0.0 /100 | #302 | Tragic 80.2% |
| Immigrants | Azores | 0.0 /100 | #303 | Tragic 80.1% |
| Hispanics or Latinos | 0.0 /100 | #304 | Tragic 80.1% |
| Immigrants | Dominican Republic | 0.0 /100 | #305 | Tragic 80.1% |
| Spanish Americans | 0.0 /100 | #306 | Tragic 80.1% |
| Blackfeet | 0.0 /100 | #307 | Tragic 80.0% |
| Central American Indians | 0.0 /100 | #308 | Tragic 80.0% |
| Potawatomi | 0.0 /100 | #309 | Tragic 80.0% |
| Inupiat | 0.0 /100 | #310 | Tragic 79.9% |
| Mexicans | 0.0 /100 | #311 | Tragic 79.8% |
| Immigrants | Mexico | 0.0 /100 | #312 | Tragic 79.7% |
| Colville | 0.0 /100 | #313 | Tragic 79.5% |
| Ottawa | 0.0 /100 | #314 | Tragic 79.5% |
| Blacks/African Americans | 0.0 /100 | #315 | Tragic 79.3% |
| Shoshone | 0.0 /100 | #316 | Tragic 79.3% |
Demographics Similar to Immigrants from Australia by In Labor Force | Age 45-54
In terms of in labor force | age 45-54, the demographic groups most similar to Immigrants from Australia are Immigrants from Southern Europe (82.9%, a difference of 0.0%), Immigrants from Philippines (82.9%, a difference of 0.010%), Immigrants from Saudi Arabia (82.9%, a difference of 0.010%), Immigrants from Indonesia (82.9%, a difference of 0.020%), and Immigrants from Ghana (82.9%, a difference of 0.020%).
| Demographics | Rating | Rank | In Labor Force | Age 45-54 |
| Immigrants | Netherlands | 72.6 /100 | #150 | Good 82.9% |
| Koreans | 71.9 /100 | #151 | Good 82.9% |
| Slavs | 71.5 /100 | #152 | Good 82.9% |
| Immigrants | Indonesia | 70.6 /100 | #153 | Good 82.9% |
| Immigrants | Ghana | 70.3 /100 | #154 | Good 82.9% |
| Immigrants | Philippines | 69.0 /100 | #155 | Good 82.9% |
| Immigrants | Saudi Arabia | 68.8 /100 | #156 | Good 82.9% |
| Immigrants | Australia | 68.2 /100 | #157 | Good 82.9% |
| Immigrants | Southern Europe | 67.8 /100 | #158 | Good 82.9% |
| Immigrants | Austria | 64.6 /100 | #159 | Good 82.9% |
| Laotians | 62.8 /100 | #160 | Good 82.9% |
| South American Indians | 62.2 /100 | #161 | Good 82.9% |
| Haitians | 61.8 /100 | #162 | Good 82.8% |
| Dutch | 61.7 /100 | #163 | Good 82.8% |
| German Russians | 61.3 /100 | #164 | Good 82.8% |